





Table of Contents
- Part 1: Amazon Q3 2026 Earnings Analysis
- Amazon Revenue Growth and Quarterly Performance
- Amazon Business Segments: North America, International, and AWS
- Amazon Operating Income and Profitability
- Amazon Net Income and Earnings Per Share
- Amazon Operating Cash Flow and Free Cash Flow
- Amazon AI, AWS, and Cloud Infrastructure Developments
- Amazon Retail, Advertising, and Customer Experience
- Amazon Fourth-Quarter 2026 Guidance
- Amazon: Key Factors to Monitor
- Part 2: Intel Q3 2026 Earnings Analysis
- Intel Revenue Growth and Financial Results
- Intel Data Center and AI Business
- Intel Client Computing and Physical AI Group
- Intel Foundry Revenue and Manufacturing Strategy
- Intel Business Unit Revenue Summary
- Intel Operating Income and Margin Improvement
- Intel Cash Flow and Capital Resources
- Intel Product and Technology Developments
- Intel Quantum Computing and Strategic Initiatives
- Intel Fourth-Quarter 2026 Guidance
- Intel: Key Factors to Monitor
- Part 3: Technology Stocks and Broader Stock Market Context
- Conclusion: Amazon and Intel Q3 2026 Earnings Outlook
- Editorial Note and Disclaimer
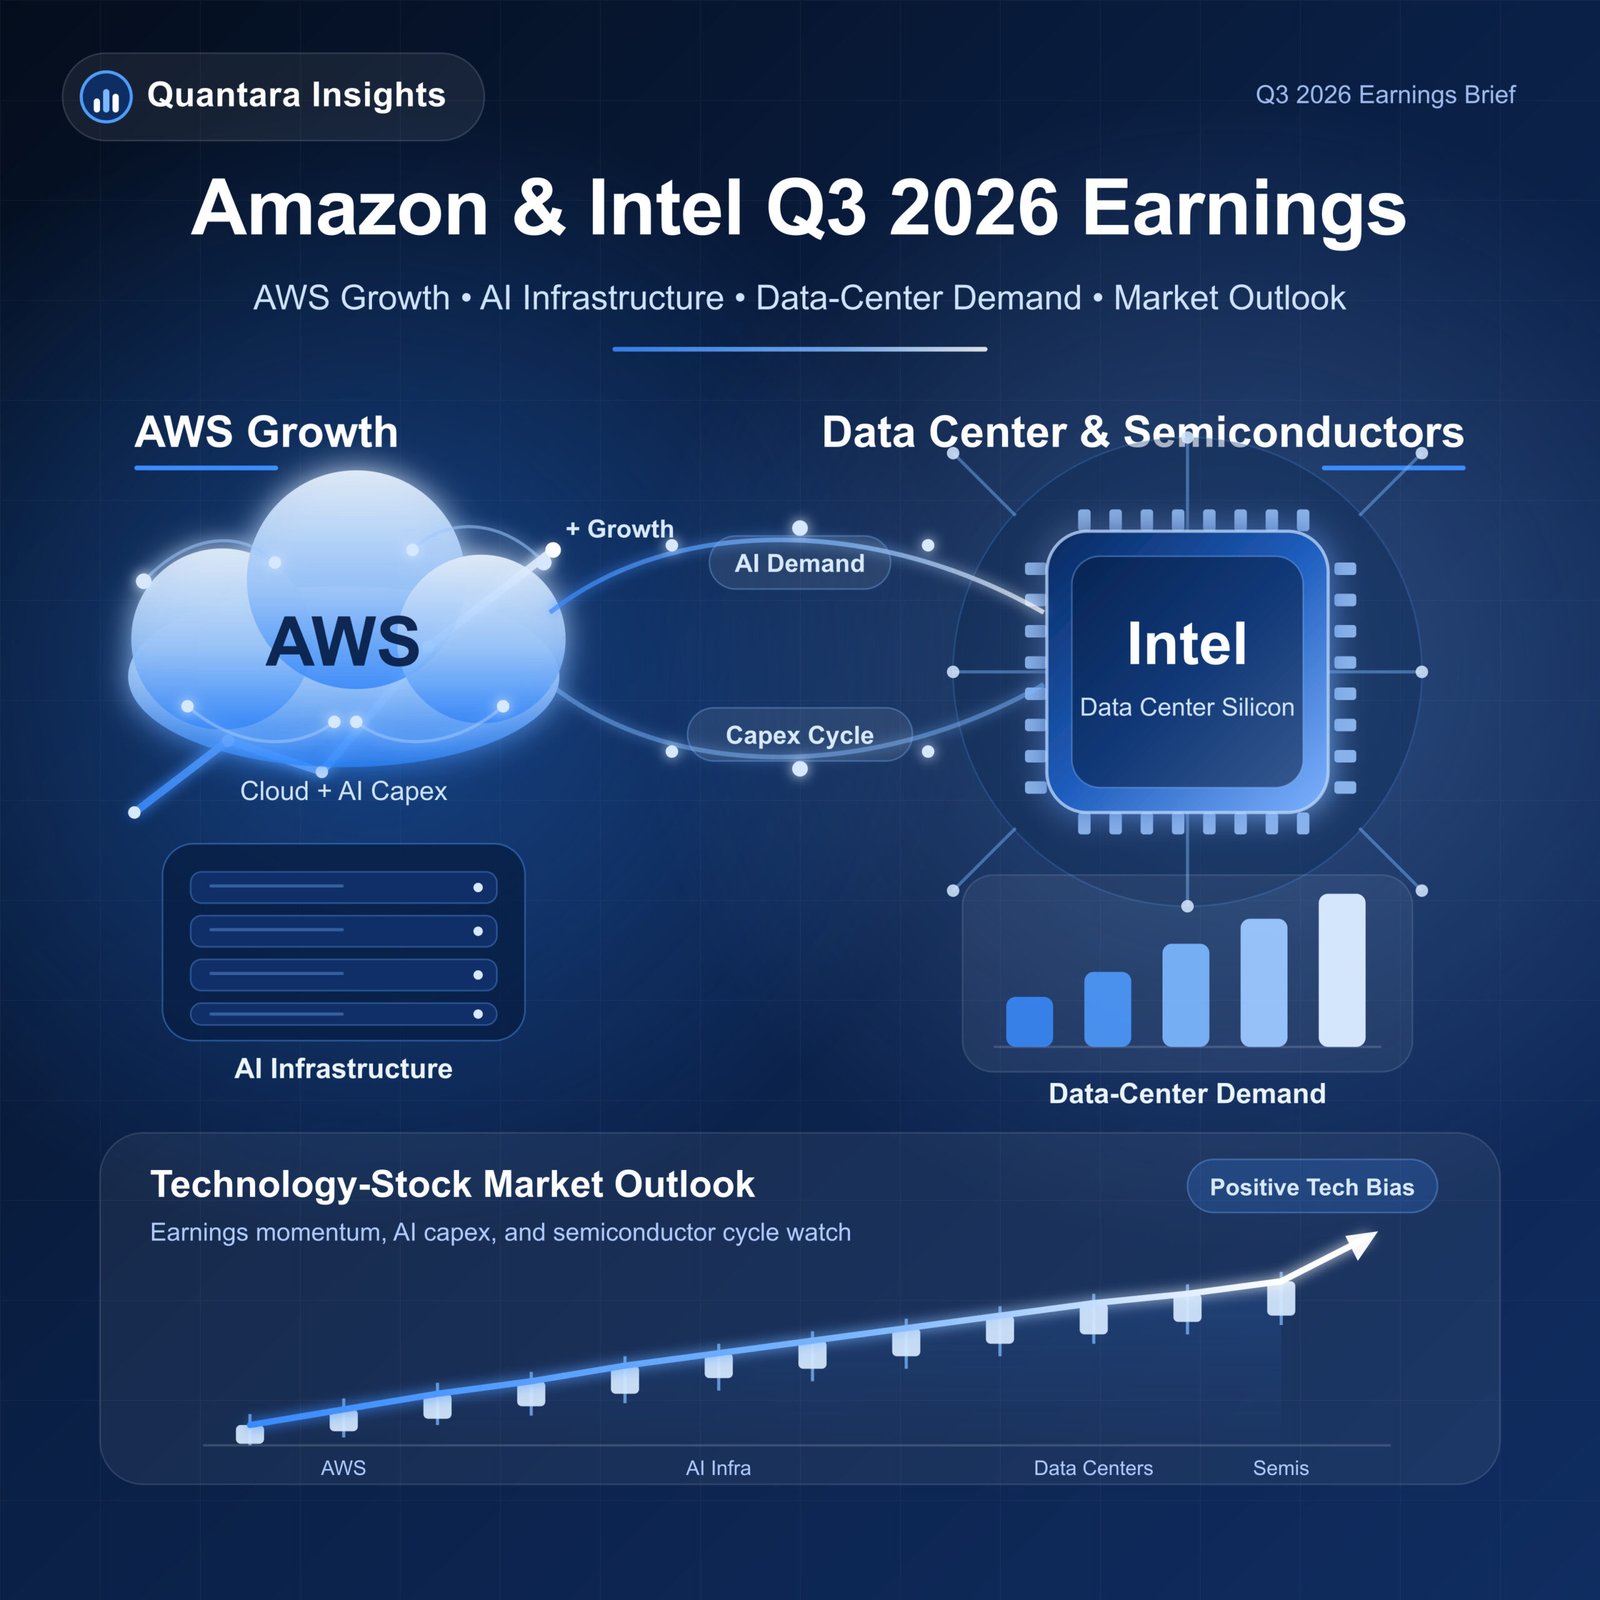
Amazon and Intel Q3 2026 earnings offer important insights into the changing technology landscape, particularly the growing role of artificial intelligence, cloud computing, data center infrastructure, and semiconductor manufacturing. Amazon reported strong revenue growth and expanding operating income, supported by accelerating Amazon Web Services (AWS) performance. Intel delivered a significant increase in revenue, with its Data Center and AI business recording substantial year-over-year growth.
Both companies are investing heavily to meet demand for AI-related infrastructure and computing capacity. However, their financial profiles, strategic priorities, and operating challenges differ. Amazon is managing a broad ecosystem spanning e-commerce, cloud services, advertising, logistics, and digital entertainment. Intel is focused on semiconductor products, manufacturing technology, supply capacity, and the long-term development of its foundry business.
The third-quarter results provide a detailed view of how these businesses are progressing, where growth is concentrated, and what investors may want to monitor in the coming quarters. This analysis reviews Amazon’s financial performance first, followed by Intel’s results, business developments, outlook, and potential implications for technology stocks and the broader stock market.
Important context: Financial figures in this article are presented in U.S. dollars. Year-over-year comparisons refer to the third quarter of 2025 unless otherwise indicated. Management guidance represents expectations as of the earnings releases dated October 29, 2026, and is not a guarantee of future results.
Part 1: Amazon Q3 2026 Earnings Analysis
Amazon Revenue Growth and Quarterly Performance
Amazon reported third-quarter 2026 net sales of $201.944 billion, compared with $180.169 billion in the same quarter of the previous year. This represented year-over-year growth of approximately 12%.
The company stated that sales growth would have been approximately 13% excluding the unfavorable impact of foreign exchange rates. Currency movements reduced reported growth by roughly $900 million.
The revenue increase reflects the scale and diversity of Amazon’s operations. The company generates revenue from online and physical retail, third-party seller services, subscriptions, advertising, and AWS. While these businesses respond to different economic conditions, they collectively provide Amazon with several sources of revenue.
The third quarter also included a timing difference related to Prime Day. In 2026, Prime Day took place in the second quarter in most large countries, while the event occurred entirely in the third quarter of 2025. Amazon estimated that, adjusting for this timing difference, its third-quarter year-over-year sales growth would have been approximately 400 basis points higher.
This distinction matters when interpreting the headline revenue figure. A portion of the reported growth comparison reflects the timing of a major shopping event rather than a change in underlying consumer demand.
| Amazon financial metric | Q3 2026 | Q3 2025 | Year-over-year change |
|---|---|---|---|
| Net sales | $201.944B | $180.169B | +12% |
| Operating income | $28.076B | $17.422B | Increased |
| Net income | $20.69B | $21.19B | Decreased |
| Diluted earnings per share | $1.89 | $1.95 | Decreased |
| Trailing 12-month operating cash flow | $168.3B | $130.7B | +29% |
The figures show a business that continued to expand revenue and operating income while reporting lower net income and diluted earnings per share. These differences are important because revenue, operating profit, and net income measure distinct aspects of financial performance.
Amazon Business Segments: North America, International, and AWS
Amazon reports three principal operating segments: North America, International, and Amazon Web Services. Each segment contributes differently to the company’s financial results.
North America and International include Amazon’s consumer-facing commerce activities, while AWS provides cloud computing services to businesses, developers, governments, and other organizations.
North America
Amazon’s North America segment generated approximately $112.9 billion in revenue, representing year-over-year growth of 6%.
Operating income increased to approximately $8.7 billion, compared with $4.8 billion in the prior-year quarter. The increase in operating income was substantially stronger than the revenue growth rate.
This improvement suggests that Amazon’s North American operations benefited from a combination of sales growth and improved operating performance. In a retail business with substantial logistics, labor, and fulfillment costs, operating income can improve when the company processes more orders through its infrastructure or manages expenses more efficiently.
Amazon’s North America segment includes online stores, physical stores, third-party seller services, advertising, and subscriptions. Its performance is therefore influenced by consumer spending, marketplace activity, advertising demand, delivery efficiency, and the economics of fulfillment.
The segment’s operating income improvement is a notable part of Amazon’s overall profitability story. It also illustrates why investors may look beyond consolidated revenue when evaluating the company.
International
Amazon’s International segment reported approximately $43.1 billion in revenue, up 5% year over year. Excluding foreign exchange effects, growth was approximately 8%.
Operating income increased to approximately $1.6 billion, compared with $1.2 billion in the prior-year quarter.
The difference between reported and currency-adjusted growth illustrates how exchange rates can affect multinational businesses. Amazon operates across markets with different currencies, consumer behavior, competitive environments, and regulatory frameworks. Currency movements can therefore influence reported results even when local operations are growing.
International profitability is also affected by the maturity of individual markets, delivery infrastructure, customer purchasing patterns, and the cost of expanding operations.
The segment’s positive operating income and revenue growth indicate continued progress, although its profitability remains smaller in absolute terms than North America’s or AWS’s.
Amazon Web Services
AWS was the strongest growth contributor among Amazon’s major operating segments.
AWS revenue reached approximately $45.984 billion, increasing 39.3% year over year. Amazon described this as its fastest AWS growth rate in nearly five years. The company also indicated that AWS had reached an annualized revenue run rate of approximately $184 billion.

AWS operating income was approximately $17.773 billion, compared with $11.434 billion in the prior-year quarter.
| Amazon operating segment | Q3 2026 revenue | Revenue growth | Q3 2026 operating income |
|---|---|---|---|
| North America | $112.9B | +6% | $8.7B |
| International | $43.1B | +5% reported; +8% excluding FX | $1.6B |
| AWS | $45.984B | +39.3% | $17.773B |
AWS is particularly important because cloud computing provides infrastructure for enterprise software, data storage, application development, analytics, and AI workloads. Organizations increasingly require computing capacity to train, deploy, and operate AI systems, creating demand for data center infrastructure and cloud services.
However, AI-related demand is not the only factor influencing AWS. Customers also use AWS for conventional cloud migration, databases, enterprise applications, and general-purpose computing. The durability of AWS growth depends on a broad set of customer needs, pricing conditions, capacity availability, and competitive dynamics.
The increase in AWS operating income is also significant. It shows that the segment’s revenue growth is translating into a larger operating profit contribution. AWS is a major source of Amazon’s consolidated operating income, making its growth and profitability important to the company’s overall financial profile.
Amazon Operating Income and Profitability
Amazon’s consolidated operating income increased to $28.076 billion, compared with $17.422 billion in the third quarter of 2025.
Operating margin reached approximately 13.9%, which Amazon described as a record level.
Operating income measures profit from the company’s operations before non-operating items and income taxes. It provides a useful view of how effectively a business converts revenue into operating profit.
Amazon’s improvement in operating income was substantially stronger than its revenue growth. The results suggest that the company’s operating performance benefited from a combination of revenue expansion and improvements across its business segments.
The operating income increase was supported by higher operating income in North America, International, and AWS. AWS made a particularly large contribution, with operating income increasing by more than $6 billion compared with the prior-year quarter.
Amazon’s retail operations also remain relevant to its profitability. Retail businesses often operate with lower margins than cloud computing, but improvements in fulfillment efficiency, inventory management, delivery speed, advertising, and third-party seller services can influence their financial contribution.
The company’s operating margin is therefore best understood as the result of multiple businesses with different economics rather than a single uniform operating model.
Amazon Net Income and Earnings Per Share
Despite higher revenue and operating income, Amazon reported lower net income and diluted earnings per share.
Net income was approximately $20.69 billion, compared with $21.19 billion in the third quarter of 2025. Diluted earnings per share declined to $1.89 from $1.95.
This difference between operating income and net income is important. Operating income reflects the performance of the company’s operations, while net income also incorporates non-operating items, interest-related effects, taxes, and other items.
Amazon noted that the prior-year quarter included approximately $9.5 billion in pre-tax non-operating gains associated with its investments in Anthropic. Those gains influenced the comparison with the third quarter of 2026.
Consequently, the decline in net income does not mean Amazon’s operating performance weakened during the quarter. Operating income increased substantially, while the prior-year net income figure benefited from a significant investment-related gain.
Investors reviewing Amazon earnings should distinguish between operating performance and non-operating changes. A single net income figure may not fully capture the underlying direction of the company’s operating businesses.
Amazon Operating Cash Flow and Free Cash Flow
Cash flow remains a central consideration in Amazon’s financial performance, particularly because the company is investing heavily in infrastructure.
Amazon’s trailing 12-month operating cash flow increased 29% to $168.3 billion, compared with $130.7 billion in the prior-year period.
Operating cash flow measures cash generated by the company’s operating activities. It provides information about the cash-producing capacity of the business, although it can also be affected by working capital, payment timing, and other factors.
Amazon’s trailing 12-month free cash flow, however, was a negative $42.4 billion.
The company attributed the free cash flow result primarily to a substantial increase in capital expenditures. Purchases of property and equipment, net of proceeds from sales and incentives, increased by approximately $94.8 billion year over year.
Amazon’s trailing 12-month capital expenditure purchases, net of incentives, reached approximately $210.7 billion, compared with $115.9 billion in the prior-year period.
This creates an important distinction for investors:
- Operating cash flow: The cash Amazon generates through operating activities.
- Capital expenditures: Cash invested in property, equipment, infrastructure, and other long-lived assets.
- Free cash flow: A measure that reflects operating cash flow after specified capital spending.
Amazon can generate substantial operating cash flow while reporting negative free cash flow if capital investment is unusually high.
The company’s investment program includes infrastructure needed to support AWS and AI-related demand. Data centers require buildings, power systems, networking equipment, servers, and other assets. These investments can be expensive and may take time to generate revenue and returns.
Amazon maintained its expectation for approximately $220 billion in 2026 cash capital expenditures. That level of spending signals management’s intention to continue investing in capacity and infrastructure.
The potential benefit is that additional capacity may allow Amazon to support customer demand and expand its cloud services. The risk is that investment returns may be delayed, demand could change, or infrastructure costs could rise faster than expected.
Amazon AI, AWS, and Cloud Infrastructure Developments
Amazon’s third-quarter developments highlight the growing importance of AI across its businesses.
AWS is positioned to provide cloud infrastructure and services for organizations building and deploying AI applications. Amazon’s broader AI strategy also includes tools, models, and services intended to support enterprise customers and developers.
AI infrastructure demand can influence AWS through several channels. Customers may require additional computing capacity, data storage, networking, model access, and tools for managing AI applications. These services can contribute to cloud revenue as organizations move from experimentation toward more regular deployment.
The economic opportunity is not automatic. Customers may optimize their workloads, negotiate prices, choose competing cloud providers, or delay projects. Amazon must also invest in sufficient infrastructure to serve demand while managing operating costs and capital intensity.
Amazon’s earnings release also described developments in advertising, devices, digital entertainment, and customer services.
These initiatives matter because Amazon’s AI strategy is not limited to AWS. AI can support advertising campaign planning, shopping experiences, customer assistance, and internal operations. However, the financial contribution of each initiative may vary, and not every product announcement will have an immediate material effect on quarterly revenue.
Amazon Retail, Advertising, and Customer Experience
Amazon’s retail operations remain a major part of the company’s business model.
The company highlighted continued developments in delivery speed, grocery services, shopping assistance, and customer benefits. It also reported growth in Amazon Pharmacy customers and repeat customers.
These areas can influence Amazon’s long-term performance through customer retention, order frequency, marketplace activity, and operating efficiency.
Faster delivery may improve customer convenience and encourage more frequent purchasing. Grocery services can increase engagement because customers often purchase household essentials regularly. Pharmacy services may create additional customer touchpoints, although the business also operates in a highly regulated and competitive environment.
Amazon’s advertising business is another important part of its ecosystem. Advertising connects brands and sellers with customers who are already using Amazon’s shopping, browsing, and streaming services.
The company introduced Amazon Ads Agent and expanded AI-based campaign capabilities. These tools are intended to help advertisers plan, execute, and optimize campaigns.
Advertising can be strategically valuable because it uses Amazon’s commerce and media ecosystem to generate revenue beyond the sale of physical products. Its performance, however, depends on advertiser demand, campaign effectiveness, competition, and the value advertisers receive.
Amazon’s consumer-facing businesses are interconnected. Retail can attract customers, customer activity can support advertising, and logistics infrastructure can improve delivery. The financial impact of these relationships depends on execution and the economics of each service.
Amazon Fourth-Quarter 2026 Guidance
Amazon provided the following guidance for the fourth quarter of 2026:
| Amazon Q4 2026 guidance | Expected range |
|---|---|
| Net sales | $240B–$247B |
| Year-over-year net sales growth | 12%–16% |
| Operating income | $28.5B–$33.5B |
| 2026 cash capital expenditures | Approximately $220B |
Amazon’s revenue guidance anticipates an unfavorable foreign exchange impact of approximately 60 basis points.
The company also indicated that it expects advertising revenue to grow in the high teens during the fourth quarter, excluding foreign exchange effects, while noting that third-quarter advertising growth was affected by timing anomalies primarily related to Prime Day and other factors.
Fourth-quarter guidance is particularly relevant because it includes the holiday shopping period. Retail demand, delivery capacity, advertising activity, and customer spending can all influence Amazon’s results.
The operating income range provides another signal of management’s expectations. The company expects operating income to be higher than the $25 billion reported in the fourth quarter of 2025, although the range is wide enough to reflect uncertainty around demand, expenses, and operating conditions.
Guidance should not be treated as a promise. Amazon explicitly noted that results can be affected by currency movements, energy prices, economic conditions, tariffs, supply volatility, inflation, interest rates, labor market conditions, and changes in customer demand.
Amazon: Key Factors to Monitor
Amazon’s Q3 results point to several areas that may remain important for investors.
AWS growth and profitability: AWS delivered the strongest growth among Amazon’s main operating segments. Continued expansion could support consolidated operating income, but investors may also monitor infrastructure costs and capacity availability.
Capital expenditure and free cash flow: Amazon’s investment spending is substantial. The relationship between capital expenditures, operating cash flow, and future revenue will be important in assessing whether investment is translating into sustainable returns.
Retail operating efficiency: Improvements in North America and International operating income suggest that retail profitability deserves attention alongside revenue growth.
Advertising performance: Advertising can diversify Amazon’s revenue and contribute to profitability, but performance depends on advertiser demand and campaign economics.
Holiday-quarter execution: Amazon’s Q4 outlook places emphasis on the company’s ability to manage demand, logistics, operating expenses, and customer expectations during the holiday season.

Amazon’s results show strong operating momentum, particularly in AWS. At the same time, its investment requirements are high, and free cash flow reflects the scale of its infrastructure program. Investors may therefore assess both growth potential and the timing of investment returns.
Part 2: Intel Q3 2026 Earnings Analysis
Intel Revenue Growth and Financial Results
Intel reported third-quarter 2026 revenue of $16.5 billion, an increase of approximately 21% year over year.
The company’s reported results showed improvement in revenue, gross margin, operating margin, and non-GAAP earnings per share. Intel also reported strong demand for its data center and AI products, while management noted continued near-term challenges in the PC industry.
Intel’s results reflect a semiconductor business operating across several interconnected areas. It designs and sells processors and other products, invests in manufacturing technology, and operates a foundry business intended to support semiconductor production.
The company’s financial performance is affected by product demand, manufacturing costs, supply availability, competition, capital expenditure, and the pace of technology development.
| Intel financial metric | Q3 2026 | Q3 2025 | Year-over-year change |
|---|---|---|---|
| Revenue | $16.5B | $13.7B | +21% |
| GAAP gross margin | 43.0% | 38.2% | +4.8 percentage points |
| Non-GAAP gross margin | 44.1% | 40.0% | +4.1 percentage points |
| GAAP operating margin | 15.3% | 5.0% | +10.3 percentage points |
| Non-GAAP operating margin | 19.6% | 11.2% | +8.4 percentage points |
| GAAP diluted EPS | $0.60 | $0.90 | Decreased |
| Non-GAAP diluted EPS | $0.52 | $0.23 | Increased |
Intel reported GAAP net income attributable to Intel of approximately $3.3 billion, compared with $4.1 billion in the prior-year quarter. GAAP diluted earnings per share declined to $0.60 from $0.90.
Non-GAAP net income attributable to Intel increased to approximately $2.8 billion from $1.0 billion, while non-GAAP diluted EPS increased to $0.52 from $0.23.
The difference between GAAP and non-GAAP measures is relevant when reviewing Intel’s results. GAAP figures follow generally accepted accounting principles. Non-GAAP figures adjust for certain items defined by the company. These measures can provide additional context, but they are not substitutes for GAAP results and may not be directly comparable across companies.
Intel’s reported increase in revenue and margins indicates a stronger operating quarter, although the decline in GAAP net income and EPS shows that the overall earnings picture includes factors beyond revenue and operating margin.
Intel Data Center and AI Business
Intel’s Data Center and AI group was a major contributor to third-quarter growth.
The segment reported revenue of approximately $7.3 billion, an increase of 78% year over year.
Intel described the quarter as its strongest data center revenue growth in 15 years. Management also highlighted robust demand for the Xeon processor family and stated that increasing supply was an immediate priority.
Data center computing is important to the semiconductor industry because cloud providers, enterprises, and AI developers require processing capacity for a broad range of workloads.
CPUs remain central to many data center systems. They support general-purpose computing, data processing, orchestration, and workloads that operate alongside accelerators and other specialized hardware.
AI-related infrastructure does not rely on a single type of chip. Systems can include CPUs, GPUs, networking components, memory, storage, and software. Demand for one component may influence demand for others, although the relationship depends on system design and workload requirements.
Intel’s DCAI growth indicates that demand for its data center products increased substantially during the quarter. The company’s ability to meet that demand is also important. If supply constraints limit shipments, revenue opportunities may be delayed even when customer demand is strong.
Intel management stated that its priority was to unlock additional supply for Xeon products. That focus reflects the importance of balancing customer demand with manufacturing and supply-chain capacity.
Intel Client Computing and Physical AI Group
Intel’s Client Computing and Physical AI Group, or CCPG, reported revenue of approximately $8.1 billion, down 5% year over year.
The segment includes client computing products and activities associated with physical AI. Its performance is influenced by PC demand, product cycles, competition, customer inventory levels, and the availability of components.
Intel management noted that near-term PC industry headwinds were continuing. The company’s CFO also indicated that the PC slowdown was expected to persist at least through the first half of the following year.
This outlook is relevant because PC demand can be affected by replacement cycles, economic conditions, business spending, and consumer purchasing decisions. Even when data center demand is strong, weakness in the PC market can affect Intel’s overall revenue mix.
Intel’s product roadmap includes processors for client systems, edge computing, and other workloads. New product launches may create opportunities to improve performance and expand use cases, but their financial impact depends on customer adoption, product availability, and competition.
Intel Foundry Revenue and Manufacturing Strategy
Intel Foundry reported third-quarter revenue of approximately $6.7 billion, up 58% year over year.
Foundry revenue includes manufacturing-related activity and intersegment transactions. It should not be interpreted as equivalent to revenue from external foundry customers alone.
Intel’s manufacturing strategy is a major part of its long-term business plan. The company has invested in process technology, manufacturing capacity, advanced packaging, and partnerships intended to support semiconductor production.
The foundry business is strategically important because Intel aims to provide manufacturing services and technology that can serve both its own product requirements and external customers.
However, manufacturing investments are capital-intensive and technically complex. New process technologies must meet performance, cost, yield, and reliability requirements. External customers also need confidence in manufacturing capability, capacity, and product roadmaps before committing significant production volumes.
Intel reported several developments related to its foundry strategy during the quarter:
- The company released the Intel 14A 0.9 process design kit in October.
- Intel announced a collaboration with Lens Technology focused on advanced semiconductor packaging.
- The company completed the RAMP-C program, enabling validated prototypes and further customer engagement for Secure Enclave.
- Intel announced a collaboration with ASML intended to accelerate industry readiness for High-NA EUV manufacturing.
- Intel worked with Lam Research and Applied Materials on facilities intended to expand capacity and support joint research and development.
These developments illustrate the breadth of Intel’s manufacturing strategy. Process technology, packaging, equipment, ecosystem readiness, and customer engagement are all relevant to the long-term development of a foundry business.
The commercial outcome remains uncertain. The company must translate technology development and manufacturing investment into competitive products, customer commitments, production volumes, and acceptable financial returns.
Intel Business Unit Revenue Summary
Intel’s business unit results show that the company’s growth was concentrated in data center and AI, while client computing revenue declined.
| Intel business unit | Q3 2026 revenue | Year-over-year trend |
|---|---|---|
| Client Computing and Physical AI Group (CCPG) | $8.1B | -5% |
| Data Center and AI (DCAI) | $7.3B | +78% |
| Total Intel Products | $15.4B | +22% |
| Intel Foundry | $6.7B | +58% |
| All Other | $0.7B | -30% |
| Intersegment eliminations | -$6.3B | — |
| Consolidated revenue | $16.5B | +21% |
The segment figures include intersegment transactions, which are eliminated when Intel consolidates its financial statements. For that reason, the segment figures should not simply be added together to calculate consolidated revenue.
Intel Products includes the client computing and data center businesses. Intel Foundry includes manufacturing activity, including intersegment activity. The consolidated result reflects the accounting treatment of those relationships.
The table highlights a business mix in transition. Data center and AI revenue increased rapidly, while the client computing segment faced a more difficult market. The extent to which Intel can sustain growth across its product portfolio will depend on demand, supply availability, and its ability to execute on its product roadmap.
Intel Operating Income and Margin Improvement
Intel reported GAAP operating income of approximately $2.5 billion, compared with $683 million in the third quarter of 2025.
GAAP operating margin increased to 15.3% from 5.0%. Non-GAAP operating margin increased to 19.6% from 11.2%.
The improvement in operating margin is notable because semiconductor businesses face substantial fixed costs associated with research and development, manufacturing facilities, equipment, and product development.
When revenue increases, those fixed costs can be spread across a larger sales base. However, margin improvement also depends on product mix, manufacturing efficiency, pricing, and other expenses.
Intel’s results suggest that the company’s stronger revenue and operating performance contributed to a substantial improvement in operating profitability.
The company also reported higher gross margin. GAAP gross margin increased to 43.0%, while non-GAAP gross margin increased to 44.1%.
Gross margin reflects the relationship between revenue and cost of sales. It can be influenced by product mix, manufacturing costs, capacity utilization, inventory effects, and other factors.
Investors may want to monitor whether Intel can maintain or improve these margins as it increases supply, develops new products, and continues investing in manufacturing technology.
Intel Cash Flow and Capital Resources
Intel generated approximately $5.1 billion in cash from operations during the third quarter.
The company also completed a $23 billion public equity offering intended to support future growth opportunities while maintaining a strong balance sheet and investment-grade rating.
Capital resources are important to Intel because its business requires significant investment in manufacturing facilities, equipment, research and development, and working capital.
Intel’s financial position and access to capital can influence its ability to support those investments. At the same time, large investments create financial obligations and can affect shareholder returns, dilution, and future cash flow.
The public equity offering provides additional capital, but it also increases the number of shares outstanding. Investors assessing the impact of the offering may consider both the funding benefits and the potential effect on per-share financial measures.
Intel’s capital requirements are connected to its manufacturing strategy. Expanding capacity and developing advanced process technologies can require substantial upfront spending, while revenue and profitability may develop over time.
The company’s long-term financial performance will therefore depend not only on product demand but also on the timing, cost, and returns of its investment program.
Intel Product and Technology Developments
Intel reported several product developments during the third quarter, spanning server processors, client computing, AI infrastructure, and software.
The company announced a multiyear collaboration with Oracle intended to expand Intel Xeon-based computing on Oracle Cloud Infrastructure. The collaboration is expected to span current and future Xeon platforms, including planned OCI X14 offerings powered by Intel’s next-generation server processor, code-named Diamond Rapids.
Intel also shared technical details about its GPU D-series, introduced new Xeon-based rack designs, and highlighted software and ecosystem developments.
The company reported that it had demonstrated day-zero support for Meta’s Muse Spark Open, which had been tested and was running on upcoming Intel GPU D-series and Xeon platforms.
Intel also highlighted architectures intended to support agentic AI and enterprise-scale workloads. These include:
- Next-generation Xeon processors for high-performance orchestration.
- Intel GPU D-series products for inference workloads.
- Intel Core Series 3 products for client and edge computing.
These developments reflect Intel’s effort to position its products across a range of AI-related workloads. However, product announcements and demonstrations do not necessarily translate into immediate revenue. Commercial adoption depends on product availability, performance, software compatibility, pricing, customer requirements, and competition.
Intel also announced Googlebook devices powered by Intel Core Ultra Series 3 processors, collaboration with AMD on x86 CPU optimizations for PyTorch through oneDNN, and work with SAP related to Physical AI.
These activities illustrate Intel’s broader approach to strengthening its product and software ecosystem. The company’s ability to convert these initiatives into sustained business growth remains an important factor for investors to monitor.
Intel Quantum Computing and Strategic Initiatives
Intel announced plans to acquire Classiq, combining Classiq’s quantum software synthesis platform with Intel’s spin-qubit manufacturing and software expertise.
The stated objective is to create a full-stack quantum computing platform.
Quantum computing remains a developing technology area, and its commercial trajectory is uncertain. The strategic rationale for Intel’s planned acquisition is to combine software and hardware-related capabilities, but the timing and scale of any eventual financial contribution are not established by the third-quarter earnings release.
For investors, the initiative is best understood as a longer-term strategic development rather than a direct explanation for Intel’s current quarterly revenue.
The company’s immediate financial performance continues to be driven primarily by its semiconductor products, data center demand, client computing, manufacturing operations, and capital investment.
Intel Fourth-Quarter 2026 Guidance
Intel provided the following fourth-quarter outlook:
| Intel Q4 2026 guidance | GAAP | Non-GAAP |
|---|---|---|
| Revenue | $15.0B–$16.0B | — |
| Gross margin | 37.1% | 38.0% |
| Tax rate | 31% | 11% |
| Diluted EPS attributable to Intel | $0.10 | $0.25 |
Intel’s revenue outlook indicates a sequential range that may reflect both demand and supply conditions. Management noted that it expected the PC slowdown to continue at least through the first half of the following year, while remaining optimistic about opportunities across its broader portfolio.
The company also stated that it would continue making disciplined investments in capacity and working capital to increase supply and support future growth.
The gross margin and EPS outlooks are based on the midpoint of the revenue range. Actual results may differ materially from guidance because of demand changes, product mix, manufacturing execution, supply availability, market conditions, and other risks.
The difference between Intel’s GAAP and non-GAAP guidance is also worth noting. The measures use different accounting treatments, so investors should review both rather than relying on a single earnings-per-share estimate.
Intel: Key Factors to Monitor
Intel’s third-quarter results suggest improvement in revenue and operating performance, but several issues remain important.
Data center demand: The 78% increase in DCAI revenue indicates strong demand. Sustaining growth will depend on customer requirements, product competitiveness, and Intel’s ability to supply products.

PC market conditions: CCPG revenue declined 5%, and management expected near-term PC industry weakness to continue. Client computing performance remains a potential offset to data center growth.
Foundry execution: Intel’s manufacturing strategy involves long-term investment and technology development. Customer adoption, production yields, capacity, and manufacturing costs will be important to the business’s future financial contribution.
Capital requirements: Semiconductor manufacturing requires significant spending. Intel’s access to capital and ability to allocate resources effectively are important to its long-term strategy.
Margin trends: The company reported substantial margin improvement. Investors may monitor whether the improvement is sustained as product mix, supply, and manufacturing conditions evolve.
Intel’s Q3 results show meaningful progress, particularly in data center revenue and operating margin. The company’s longer-term performance will depend on its ability to sustain product demand, improve supply, execute its manufacturing roadmap, and manage capital-intensive investments.
Part 3: Technology Stocks and Broader Stock Market Context
AI Infrastructure Is Influencing Technology Investment
Amazon and Intel operate in different parts of the technology industry, but their third-quarter results highlight the importance of AI infrastructure.
Amazon’s AWS business provides cloud services and computing capacity. Intel supplies semiconductor products used in data center and other computing systems. Both companies are investing to address demand associated with AI, although their revenue models and operating economics differ.
AI infrastructure investment can create opportunities across several categories:
- Cloud computing and data center services.
- CPUs, GPUs, and specialized processors.
- Networking and connectivity.
- Memory and storage.
- Data center power, cooling, and physical infrastructure.
- Enterprise software and AI development tools.
The expansion of AI-related demand may support revenue growth for companies serving these markets. However, the benefits are unlikely to be uniform. Companies differ in their product competitiveness, customer relationships, pricing power, capital requirements, and ability to convert demand into earnings and cash flow.
Investors evaluating technology stocks may therefore want to distinguish between exposure to a growing market and the ability to earn attractive returns within that market.
Revenue Growth Does Not Always Mean Higher Free Cash Flow
Amazon’s third-quarter results illustrate how a company can report higher revenue and operating income while free cash flow remains negative.
The company’s operating cash flow increased, but capital expenditure also rose substantially. This reflects the cost of investing in infrastructure intended to support future business activity.
Intel faces a related issue through its manufacturing investments. Semiconductor production requires expensive facilities, equipment, research and development, and process technology development.
For both companies, capital spending can support future growth. But investors may also consider the risk that demand changes, competition increases, or investment returns take longer than expected.
A useful framework for reviewing technology company earnings includes:
- Revenue growth and its sources.
- Operating income and operating margin.
- Cash flow from operations.
- Capital expenditure and free cash flow.
- Management guidance.
- The expected returns and risks associated with investment.
This approach helps distinguish between growth that is already generating financial returns and growth that depends on future investment outcomes.
Earnings Expectations and Stock Market Reactions
Stock market performance following an earnings release depends on more than whether a company reports higher revenue or profit than the previous year.
Investors and analysts often evaluate results against expectations. A company may report strong year-over-year growth but experience a negative share-price reaction if the results or guidance fall short of what the market had anticipated.
Conversely, a company may report modest growth but see its shares respond positively if its results exceed expectations or its outlook improves.
Several factors can influence the market’s interpretation of earnings:
- Revenue and earnings relative to analyst expectations.
- Management’s forward guidance.
- Profit margins and cash flow.
- Capital expenditure plans.
- Demand trends and supply constraints.
- Competitive developments.
- Interest rates and broader economic conditions.
- Valuation and investor positioning.
Amazon’s large capital expenditure program may attract attention because it affects free cash flow and the timing of investment returns. Intel’s results may be evaluated in the context of data center demand, manufacturing execution, and its longer-term foundry strategy.
These are examples of factors that may influence investor analysis, not predictions of how either company’s stock will perform.
Why Guidance Can Matter as Much as Reported Results
Quarterly earnings provide a view of past performance. Guidance provides management’s expectations for the next reporting period.
Amazon’s fourth-quarter outlook includes revenue of $240 billion to $247 billion and operating income of $28.5 billion to $33.5 billion. Intel’s fourth-quarter outlook includes revenue of $15 billion to $16 billion, along with its gross margin and EPS estimates.
Guidance can influence how investors assess the sustainability of current performance.
For Amazon, the holiday quarter includes important retail activity and continued investment in cloud infrastructure. For Intel, the next quarter may be influenced by data center demand, PC market conditions, product supply, and manufacturing execution.
Guidance is subject to uncertainty. Companies may face changes in customer demand, competition, currency movements, costs, supply chains, and economic conditions. Investors should therefore view guidance as management’s current outlook rather than a guaranteed result.
Risks for Amazon and Intel
Both companies face risks that may influence their future financial performance.
Amazon risks
Amazon’s risks include:
- High capital expenditure and uncertainty about investment returns.
- Changes in consumer spending and online retail demand.
- Competition in cloud computing, advertising, and e-commerce.
- Currency movements affecting international revenue.
- Operating costs associated with logistics, labor, and infrastructure.
- Supply volatility, including memory chips and other components.
- Regulatory and geopolitical developments.
- The possibility that AI infrastructure demand or customer spending changes.
Amazon’s scale and business diversity can provide opportunities, but they do not eliminate these risks.
Intel risks
Intel’s risks include:
- Competition in semiconductor products and manufacturing.
- The technical complexity of developing advanced process technologies.
- Significant, long-term manufacturing and research investment.
- Supply constraints and changing customer demand.
- The cost and timing of manufacturing capacity expansion.
- The challenge of securing external foundry customers.
- Product defects, technology delays, and execution risks.
- Geopolitical tensions, tariffs, export controls, and supply-chain disruptions.
- The effects of capital structure and equity issuance on shareholders.
Intel’s manufacturing strategy may create long-term opportunities, but the results depend on execution, customer demand, and financial discipline.
A Balanced View of Technology Stock Earnings
Amazon’s and Intel’s results illustrate why technology stock analysis should consider more than a single financial metric.
Amazon reported strong revenue growth and a substantial increase in operating income. AWS was a major contributor, while higher capital expenditure weighed on free cash flow.
Intel reported higher revenue and improved operating margins. Its data center and AI business grew rapidly, while its client computing segment faced a more difficult market. Its manufacturing strategy remains a long-term investment with uncertain returns.
The companies’ financial profiles differ, and their results should be interpreted independently. Amazon’s cloud business is part of a broader commerce and services ecosystem. Intel’s business is tied to semiconductor products, manufacturing technology, and supply capacity.
For investors, the central questions are whether growth is sustainable, whether profitability can improve, whether capital investments can generate adequate returns, and how management’s outlook compares with market expectations.
Conclusion: Amazon and Intel Q3 2026 Earnings Outlook
Amazon and Intel Q3 2026 earnings highlight the continued importance of cloud computing, AI infrastructure, and semiconductor demand within the technology sector.
Amazon reported net sales of $201.944 billion, up approximately 12% year over year. Operating income increased to $28.076 billion, while AWS revenue grew 39.3% to approximately $45.984 billion. The company also reported higher operating cash flow and a substantial capital expenditure program, resulting in negative trailing 12-month free cash flow.
Intel reported revenue of approximately $16.5 billion, up 21% year over year. Its Data Center and AI group grew 78%, while GAAP and non-GAAP operating margins improved. The company’s client computing business declined, and its manufacturing strategy continues to require significant investment and execution.
Both companies are investing to support future growth, but their financial priorities differ. Amazon’s results emphasize AWS expansion, operating profitability, and infrastructure spending. Intel’s results emphasize data center demand, product supply, manufacturing technology, and the development of its foundry business.
For technology stocks and the broader stock market, these earnings reports provide insight into current business trends. They do not, by themselves, establish how either company’s shares will perform. Investors may wish to assess the companies’ financial results, guidance, valuation, risks, and longer-term investment requirements before drawing conclusions.
The next quarters will help show whether Amazon can translate infrastructure spending into durable cash flow and whether Intel can sustain its data center momentum while advancing its manufacturing roadmap.
Editorial Note and Disclaimer
This article is intended for informational and educational purposes only. It summarizes and analyzes company-reported financial results and management outlooks. It does not constitute investment advice, a recommendation to buy or sell securities, or a guarantee of future performance.
Financial results, management guidance, and market conditions can change. Readers should conduct their own research and consider consulting a qualified financial professional before making investment decisions.