







Table of Contents
- 1. Netflix Q3 2026 Earnings: Revenue and Profitability
- 2. Netflix Revenue Growth: Subscriptions, Pricing and Retention
- 3. Netflix Content Strategy and International Growth
- 4. Netflix Financial Outlook for Q4 and Full-Year 2026
- 5. Netflix Cash Flow, Debt and Capital Allocation
- 6. SpaceX Q3 2026 Earnings: Revenue Accelerates
- 7. SpaceX Business Segments: Space, Connectivity and Super Intelligence
- 8. SpaceX Capital Spending, Cursor and Infrastructure Investment
- 9. Netflix vs. SpaceX: Comparing Revenue Growth and Profitability
- 10. Stock Market Implications: What Investors Should Examine
- 11. Risks and Uncertainties Affecting Future Growth
- 12. What Investors Should Monitor in the Coming Quarters
- Conclusion: Netflix and SpaceX Offer Different Growth Profiles
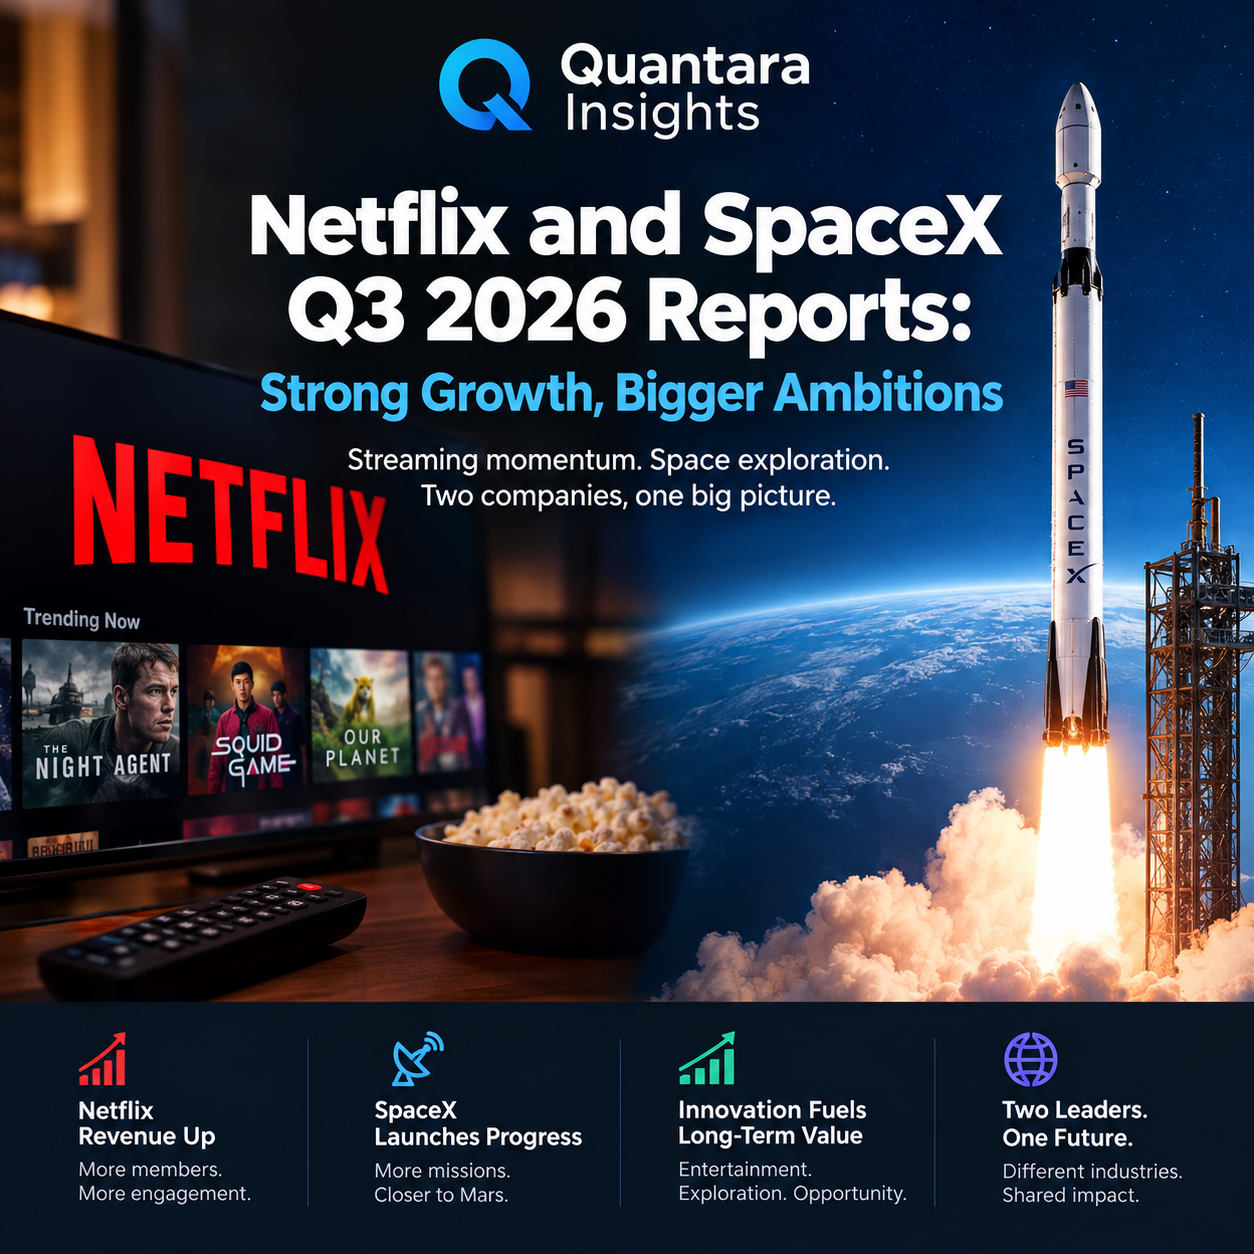
Netflix and SpaceX delivered contrasting but significant financial results in the third quarter of 2026, offering investors an opportunity to examine two businesses operating in different industries while pursuing ambitious growth strategies. Netflix continued to expand its global entertainment business through subscriptions, pricing, advertising and content investment, while SpaceX reported rapid revenue growth across its space, connectivity and Super Intelligence operations.
The latest earnings reports highlight an important distinction between generating revenue and converting that revenue into sustainable profits and cash flow. Netflix reported revenue of $12.87 billion, operating income of $4.46 billion and net income of $3.66 billion for the quarter ended September 30, 2026. SpaceX reported revenue of $14.58 billion, operating income of $2.79 billion and net income of $4.40 billion.
Both companies are investing in opportunities that management believes can support future growth. Netflix is developing its advertising business, expanding its content offering and improving its technology platform. SpaceX is increasing satellite connectivity capacity, expanding launch operations and investing heavily in computing infrastructure and artificial intelligence-related services.
However, their financial profiles differ considerably. Netflix’s quarterly operating margin was 34.6%, while SpaceX’s consolidated operating margin was approximately 19.2%. SpaceX also recorded substantially higher capital expenditure, reflecting its infrastructure-intensive business model.
For stock market investors, these results raise several questions. How sustainable is Netflix’s revenue growth? Can SpaceX convert its rapid expansion into consistent operating profitability and free cash flow? What role do capital spending, competitive pressures and management guidance play in evaluating both businesses?
This analysis examines the third-quarter earnings, revenue growth, profitability, cash generation, investment priorities and business outlook of Netflix and SpaceX. It uses the companies’ October 20, 2026, financial disclosures as its factual foundation and distinguishes reported financial results from forward-looking expectations.
1. Netflix Q3 2026 Earnings: Revenue and Profitability
Netflix reported revenue of $12.874 billion for the third quarter of 2026, representing year-over-year growth of 11.8%. Revenue increased from $11.510 billion in the corresponding quarter of 2025, continuing the company’s expansion despite a more moderate growth rate than it reported during several earlier periods.
The company attributed its revenue performance primarily to subscription revenue, supported by membership growth and pricing changes. Advertising revenue also contributed, while foreign exchange movements provided an additional benefit to reported revenue.
The financial results indicate that Netflix continues to generate substantial revenue from its core streaming business while developing additional monetization opportunities. Its subscription model provides a recurring revenue base, although future performance still depends on member retention, acquisition, pricing decisions and the perceived value of the service.
Netflix quarterly financial highlights
| Financial metric | Q3 2026 | Q3 2025 |
|---|---|---|
| Revenue | $12.874 billion | $11.510 billion |
| Operating income | $4.459 billion | $3.248 billion |
| Operating margin | 34.6% | 28.2% |
| Net income | $3.664 billion | $2.547 billion |
| Diluted earnings per share | $0.87 | $0.59 |
| Operating cash flow | $3.162 billion | $2.825 billion |
| Free cash flow | $2.884 billion | $2.660 billion |
Netflix’s operating income increased by approximately 37% year over year, substantially exceeding its revenue growth rate. Operating margin expanded from 28.2% to 34.6%, indicating that the company generated more operating profit for each dollar of revenue during the quarter.
Net income increased from approximately $2.55 billion to $3.66 billion. Diluted earnings per share rose from $0.59 to $0.87, an increase of approximately 47%.
These figures are important because revenue growth alone does not fully explain a company’s financial performance. When operating income grows faster than revenue, investors should examine whether the improvement reflects greater operating efficiency, favorable expense timing, changes in the revenue mix or a combination of these factors.
Netflix stated that its operating income and margin exceeded its forecast primarily because of the timing of expenses and slightly stronger-than-forecast revenue. Consequently, the margin improvement should not automatically be interpreted as a permanent change in the company’s cost structure.
The results nevertheless demonstrate that Netflix remained profitable at scale while continuing to invest in entertainment, product development and advertising infrastructure.
2. Netflix Revenue Growth: Subscriptions, Pricing and Retention
Netflix’s growth strategy combines membership expansion, subscription pricing, advertising and investments intended to strengthen engagement.
The company reported that subscription revenue remained its principal growth driver in the third quarter. Membership growth benefited from healthy retention across regions, with year-over-year churn improving globally and in the United States. Churn refers to the rate at which customers cancel a subscription or otherwise leave a service.
Retention matters because acquiring new customers can be expensive. A business that retains existing members can build recurring revenue while spreading certain operating and content costs across a larger customer base.
Netflix also reported that customer responses to its 2026 price increases were consistent with prior adjustments and management expectations. That suggests the changes did not produce a larger-than-anticipated deterioration in member retention.
However, the results do not establish that Netflix can increase prices indefinitely without affecting demand. Consumers compare streaming services with other entertainment options, and subscription budgets remain a consideration for households.
Netflix must therefore balance pricing decisions against the value members receive from its programming, product features and overall viewing experience.
The role of engagement
The company defines engagement more broadly than total viewing hours alone. Its approach includes the quantity, quality and variety of viewing, reflecting the belief that customers are more likely to retain a subscription when the service consistently provides entertainment they want to watch.
Netflix acknowledged investor concerns about the growth of viewing hours and stated that it wants to accelerate growth in this area. This is an important qualification to the positive revenue and profit results.
Revenue can increase through higher prices even when viewing hours do not rise at the same rate. While that can support short-term financial performance, sustained engagement remains important for retention, customer satisfaction and the long-term value of the service.

Netflix’s ability to maintain healthy churn while increasing prices is encouraging, but investors should continue to monitor engagement, regional performance and advertising monetization rather than relying on revenue growth alone.
Advertising as a second growth engine
Netflix is also developing advertising as a complementary source of revenue. The company is investing in its advertising technology platform, expanding programmatic access and introducing additional measurement capabilities for advertisers.
Its third-quarter report described new partnerships with MercadoLibre in Latin America and AdForm in Europe, the Middle East and Africa. It also announced plans to introduce its advertising tier in 15 additional countries during 2027, with the first group of launches scheduled for March.
Advertising creates an opportunity to generate revenue from viewers who choose a lower-priced, ad-supported subscription option. It can also allow Netflix to monetize viewing activity through a different mechanism from subscription fees.
Nevertheless, the advertising opportunity depends on execution. Advertisers need evidence that campaigns can reach relevant audiences, deliver measurable results and justify their budgets. Netflix must also maintain an appropriate balance between advertising load and the viewing experience.
The company projected approximately $2.7 billion in advertising revenue for 2026, below its earlier expectation of around $3 billion. Management attributed the adjustment to a slightly slower-than-expected rollout of certain advertising product capabilities.
This illustrates why the long-term opportunity and the near-term earnings contribution should be evaluated separately. Advertising could become increasingly important to Netflix, but the pace at which it develops remains uncertain.
3. Netflix Content Strategy and International Growth
Netflix’s content offering remains central to its competitive position. The company invests in original series, films and live events while expanding the selection of third-party programming available to subscribers.
Its third-quarter shareholder letter highlighted titles from several markets, including the United States, Mexico, Japan, Denmark, the Netherlands, Korea, Brazil, France and the United Kingdom. The breadth of this slate reflects a strategy that combines local programming with content capable of attracting audiences internationally.
Netflix reported that non-English-language viewing had grown from less than 10% of total viewing a decade earlier to more than one-third. This shift demonstrates the international importance of programming produced outside English-language markets.
A successful local production can attract subscribers in its home market and potentially find a larger audience elsewhere. That creates opportunities to spread the commercial value of a production across multiple territories, although actual performance depends on viewing demand, licensing arrangements, production costs and distribution.
Licensing and partnerships
Original productions are only one part of Netflix’s content strategy. The company is also expanding through licensing agreements and partnerships that bring third-party entertainment to its platform.
The report identified a partnership with French broadcaster TF1, which allows Netflix subscribers in France to access additional local series, films, news and sports programming. Management stated that early indicators showed incremental viewing associated with the partnership.
Netflix also described a licensing agreement with Disney covering a selection of current and library titles. These arrangements can help broaden the service’s appeal and complement original programming.
The strategic benefit is straightforward: a broader catalogue can improve the likelihood that subscribers find something they want to watch. It can also help Netflix serve different age groups, interests and regional preferences.
However, licensing has economic trade-offs. The cost and duration of content agreements matter, and Netflix must evaluate whether the resulting viewing and retention justify the associated expense.
Live programming and product improvements
Netflix is continuing to expand its live-event offering, including professional sports and major entertainment events. Its fourth-quarter plans included NFL games and the Tyson Fury versus Anthony Joshua boxing match.
Live events can create viewing occasions that differ from the on-demand consumption associated with films and scripted series. They may also increase the attractiveness of a subscription by offering programming that is time-sensitive and difficult to replicate through a standard catalogue.
The company is also investing in its television interface and content-discovery capabilities. Better discovery can help members find relevant programming more efficiently, potentially increasing engagement across both original and licensed content.
The central challenge is maintaining a sufficient supply of attractive programming while controlling the financial risks associated with content production, acquisition and marketing.
4. Netflix Financial Outlook for Q4 and Full-Year 2026
Netflix expects fourth-quarter 2026 revenue of approximately $13.442 billion, representing year-over-year growth of 11.5%. Its forecast operating margin is 26.0%, compared with 24.5% in the fourth quarter of 2025.
The lower forecast margin relative to the third quarter requires context. Netflix said the fourth-quarter outlook includes an approximately 120-basis-point negative impact associated with recently announced headcount reductions. It also noted that expenses and the timing of investments affect quarterly margins.
Quarterly margins can fluctuate because content spending, organizational changes, marketing campaigns and other costs do not necessarily occur evenly throughout the year. Investors should therefore consider the full-year outlook alongside the latest quarter.
Full-year guidance
Netflix expects 2026 revenue of approximately $51.1 billion, representing 13% year-over-year growth. Its expected operating margin is 31.5%, compared with 29.5% in 2025.
The company also anticipates annual operating income growth exceeding 20%. These forecasts imply that management expects operating profit to grow faster than revenue over the full year.
However, the company revised its expected advertising revenue for 2026 downward, from approximately $3 billion to $2.7 billion. It also reduced its free cash flow forecast to approximately $12 billion, compared with its previous projection of $12.5 billion, primarily because of the expected closing of a real estate transaction in the fourth quarter.
These revisions do not erase the company’s revenue growth, but they illustrate the importance of evaluating different components of financial guidance separately.
Investors should monitor whether Netflix achieves its revenue target, sustains its operating margin and develops advertising at a pace consistent with its longer-term strategy. Guidance is management’s forecast based on conditions and assumptions at the reporting date, not a guarantee of future performance.
5. Netflix Cash Flow, Debt and Capital Allocation
Netflix generated $3.16 billion in operating cash flow during the third quarter and reported free cash flow of approximately $2.88 billion.
Free cash flow is a useful measure because it indicates how much cash remains after the company deducts capital expenditure from operating cash flow. Netflix defines its free cash flow measure as cash provided by operating activities less purchases of property and equipment.
The company reported approximately $9.50 billion in free cash flow for the first nine months of 2026, compared with approximately $7.59 billion during the corresponding period of 2025.
Strong cash generation provides financial flexibility. It can help fund content investments, support product development, maintain liquidity, repay debt or return capital to shareholders.
Share repurchases and financial flexibility
Netflix repurchased 63.9 million shares for approximately $4.8 billion during the third quarter, its largest quarterly share repurchase by value according to its shareholder letter. It ended the quarter with $22.3 billion of remaining capacity under its repurchase authorizations.
Share repurchases reduce the number of shares outstanding when completed and can increase earnings per share if the reduction in share count is not offset by other factors. Their economic value to continuing shareholders depends partly on the price paid for the shares and the alternative uses of the company’s capital.
Netflix ended the quarter with approximately $8.2 billion in cash and cash equivalents and gross debt of approximately $15.3 billion. The company said gross debt was around $1 billion higher than at the end of the previous quarter following a bond issuance intended to fund an upcoming debt maturity.
These figures suggest that Netflix combines substantial cash generation with ongoing debt obligations and an active capital-return policy. Investors should assess those elements together rather than viewing repurchases in isolation.
A sustainable capital allocation strategy requires the company to preserve sufficient liquidity and maintain its ability to invest in programming and technology while returning excess capital when appropriate.
6. SpaceX Q3 2026 Earnings: Revenue Accelerates
SpaceX reported third-quarter 2026 revenue of $14.575 billion, an increase of approximately 161% from $5.576 billion in the same quarter of 2025. The company attributed its expansion primarily to rapid growth in its Super Intelligence segment and stronger connectivity revenue.
The results represent a substantial change in the company’s reported financial profile. SpaceX recorded net income of $4.404 billion, compared with a net loss of approximately $1.054 billion a year earlier. Its adjusted EBITDA rose from $2.169 billion to $8.809 billion.
Operating income reached $2.791 billion, compared with an operating loss of $273 million in the third quarter of 2025.
These measures provide different perspectives on financial performance. Revenue indicates the scale of business activity, operating income reflects profit after operating expenses, and net income includes items outside operating performance, including interest and other income or expenses and taxes. Adjusted EBITDA is a non-GAAP measure and should be considered alongside the company’s reported operating and net income figures.
SpaceX quarterly financial highlights
| Financial metric | Q3 2026 | Q3 2025 |
|---|---|---|
| Revenue | $14.575 billion | $5.576 billion |
| Operating income (loss) | $2.791 billion | -$0.273 billion |
| Net income (loss) | $4.404 billion | -$1.054 billion |
| Adjusted EBITDA | $8.809 billion | $2.169 billion |
| Capital expenditure | $19.593 billion | $6.880 billion |
The increase in revenue reflects the combined performance of three distinct segments: Space, Connectivity and Super Intelligence. Each has a different revenue model, cost structure and investment requirement.
Space generates revenue through launch services and development activities. Connectivity includes Starlink’s consumer, enterprise and government services. Super Intelligence, abbreviated as SI in the report, includes computing infrastructure, cloud services, models and software applications.
This mix matters because the fastest-growing segment may not necessarily be the most mature or the most cash-efficient. A company can report rapid consolidated growth while still investing heavily in the infrastructure required to support that expansion.
SpaceX’s latest results show meaningful progress in both revenue and profitability. However, understanding the durability of those results requires examining the individual business segments and the scale of their investment requirements.
7. SpaceX Business Segments: Space, Connectivity and Super Intelligence
SpaceX’s third-quarter performance was uneven across its three operating segments. Super Intelligence contributed the largest share of revenue, Connectivity generated substantial operating profit, and the Space segment continued to fund and develop launch and spacecraft capabilities.
Space segment: Launch services and Starship
SpaceX reported Space segment revenue of $1.767 billion in the third quarter, compared with $1.666 billion a year earlier. Revenue increased by approximately 6% year over year.
The company completed 12 customer launches during the quarter and reported 35 launches in total when internal launches were included. It also recorded launch and development revenue associated with its ongoing space programmes.
The segment reported an operating loss of approximately $7 million, compared with operating income of $259 million in the prior-year quarter. Its segment adjusted EBITDA was $357 million, down from $674 million a year earlier.
These figures demonstrate that revenue growth and operating profitability can move in different directions. SpaceX continued to generate commercial launch revenue, but research and development spending increased as the company advanced its Starship programme.

The company reported completing Starship Flight 14 and delivering 26 Starlink V3 satellites to its broadband constellation. It stated that the mission represented approximately ten times the downlink capacity added by a Falcon 9 Starlink launch.
It also announced plans for a new Starbase spaceport in Louisiana, with the first launch targeted for 2029, subject to the development and operational requirements involved.
For investors, the Space segment should be assessed not only by current-quarter profit but also by launch demand, development expenditure, reliability, capacity and the potential economic value of future missions. Those future benefits remain dependent on execution.
Connectivity: Starlink expansion and recurring revenue
Connectivity was one of SpaceX’s most important sources of operating profit during the quarter.
Revenue increased to $5.248 billion from $3.097 billion in the third quarter of 2025, representing growth of approximately 69%. Operating income rose to $2.367 billion, compared with $1.190 billion a year earlier.
Segment adjusted EBITDA increased to $3.499 billion from $1.923 billion.
Starlink’s consumer subscriber base reached 13.6 million at September 30, 2026, up from 7.2 million a year earlier. The company added 1.6 million consumer subscribers during the third quarter.
Its reported consumer monthly average revenue per user, or ARPU, was $69, compared with $83 a year earlier. That decline is worth monitoring because subscriber growth does not automatically translate into equivalent revenue growth per customer.
ARPU can be affected by pricing, geographic mix, plan selection and other commercial factors. SpaceX reported that its consumer ARPU improved from $66 in the second quarter to $69 in the third quarter, while remaining below the year-earlier level.
Connectivity revenue also includes enterprise and government customers. These markets can have different contract structures, service requirements and revenue characteristics from consumer subscriptions.
SpaceX reported strong year-over-year growth in both consumer and enterprise and government revenue. It also said Starlink was active across existing and new aviation partnerships, with more than 3,800 aircraft equipped with the service at quarter-end.
The business is therefore expanding beyond residential broadband into additional customer categories. That creates potential opportunities for growth, but also requires ongoing investment in satellite capacity, network infrastructure, equipment and customer support.
Super Intelligence: The largest source of incremental growth
Super Intelligence generated $7.560 billion in third-quarter revenue, compared with $813 million in the prior-year quarter. The company attributed this increase primarily to new cloud services agreements, the acquisition of Cursor and greater adoption of its models and software applications, including Grok Bot.
The segment’s reported revenue growth was approximately 830% year over year. It also generated $431 million in operating income, compared with an operating loss of $1.722 billion a year earlier.
However, the quarter’s operating result included approximately $1.2 billion in share-based compensation associated with the Cursor acquisition. The segment also continued to incur substantial research and development and infrastructure costs.
SpaceX reported segment adjusted EBITDA of $4.953 billion, compared with a negative $428 million in the prior-year quarter.
The difference between operating income and adjusted EBITDA is important. Adjusted EBITDA excludes certain items, including depreciation and amortization and share-based compensation, so it can provide supplementary information about operating trends but does not replace GAAP profitability measures.
SpaceX also reported that nameplate computing capacity reached 1.7 gigawatts at the end of September, up from 0.6 gigawatts a year earlier.
The SI segment’s expansion suggests that SpaceX’s growth profile is increasingly influenced by computing infrastructure and software alongside its traditional space activities. Whether this performance can be sustained will depend on customer demand, contract economics, operating costs and the returns generated by its substantial investment programme.
8. SpaceX Capital Spending, Cursor and Infrastructure Investment
SpaceX’s revenue growth is accompanied by a significant expansion in capital expenditure.
The company reported total capital expenditure of approximately $19.593 billion in the third quarter, compared with $6.880 billion in the same period of 2025. The SI segment accounted for $16.444 billion of the latest quarter’s spending, reflecting the buildout of computing infrastructure.
Capital expenditure is different from ordinary operating expense. It generally involves investments in assets expected to support operations over multiple periods, with costs often recognized through depreciation or other accounting treatments over time.
Although infrastructure spending can support future revenue, it also consumes cash and increases the importance of utilization, customer contracts and returns on invested capital.
SpaceX’s investment strategy therefore involves balancing current financial performance with the cost of expanding the capacity required for future operations.
The Cursor acquisition
SpaceX reported that it completed its acquisition of Cursor on August 14, 2026. The transaction was intended to support its strategy of integrating computing infrastructure, Super Intelligence models and applications.
The company’s disclosure described an implied equity value of $60 billion and GAAP purchase consideration of $42.5 billion, alongside equity awards associated with post-acquisition service. These are distinct accounting and transaction measures and should not be treated as interchangeable figures.
Cursor contributed $608 million in revenue to SpaceX’s consolidated results from the closing date through September 30, 2026.
Acquisitions can accelerate expansion by adding products, technology, customers and employees. They can also introduce integration costs, compensation expenses and execution risks.
The reported contribution from Cursor is relevant when assessing the sources of SI growth. Not all of the increase should be attributed to organic demand for existing products, since the acquisition and the timing of newly activated cloud agreements also influenced the reported results.
What the investment programme means for financial performance
SpaceX’s high capital expenditure indicates that the business is pursuing growth opportunities that require substantial physical infrastructure.
This is fundamentally different from a business model in which incremental revenue can be generated with relatively little additional investment in fixed assets. A computing infrastructure business must build, power, maintain and operate facilities before the full commercial benefits of that capacity can be realized.
The economic outcome depends on whether the resulting revenue and operating cash flow justify the capital deployed. High spending can be rational when demand and returns support it, but expenditure alone is not evidence of future profitability.
Investors should therefore monitor capital expenditure relative to revenue, operating cash flow, financing needs, capacity utilization and the performance of the SI segment over subsequent reporting periods.
Liquidity and balance sheet considerations
SpaceX reported cash and cash equivalents of approximately $51.3 billion at September 30, 2026, as well as marketable securities of approximately $38.6 billion.
Its balance sheet also reflected significant growth in property, plant and equipment, goodwill and other assets. Total assets were approximately $254.0 billion at quarter-end.
These figures provide context for the company’s ability to finance its expansion, but they should not be considered independently of its liabilities, contractual commitments and future capital requirements.
The company reported substantial operating cash flow for the first nine months of 2026, but also used considerable cash for investment activities. Consequently, its long-term financial position depends not just on the size of its cash balance, but on the relationship between future cash generation, capital expenditure and other obligations.
The central question is whether the expansion of computing, connectivity and launch infrastructure produces durable economic returns rather than simply increasing the scale of the business.
9. Netflix vs. SpaceX: Comparing Revenue Growth and Profitability
Netflix and SpaceX reported strong year-over-year revenue growth in the third quarter of 2026, but their results reflect different operating models and financial priorities.

Netflix operates a global entertainment platform built around subscriptions, advertising and content distribution. SpaceX combines launch services, satellite connectivity and a rapidly expanding computing and software business.
Comparing the companies is useful because it highlights different approaches to growth. It does not mean that their earnings, margins or capital requirements should be interpreted using identical assumptions.
Key financial comparison
| Metric | Netflix | SpaceX |
|---|---|---|
| Q3 2026 revenue | $12.874 billion | $14.575 billion |
| Q3 2026 revenue growth | 11.8% | 161% |
| Q3 2026 operating income | $4.459 billion | $2.791 billion |
| Q3 2026 operating margin | 34.6% | Approximately 19.2% |
| Q3 2026 net income | $3.664 billion | $4.404 billion |
| Q3 2026 capital expenditure | $0.279 billion in property and equipment purchases | $19.593 billion |
| Main growth drivers | Subscriptions, pricing and advertising | Super Intelligence, connectivity and space |
Figures are based on the companies’ third-quarter disclosures. Netflix’s capital expenditure figure reflects purchases of property and equipment used in its free cash flow calculation; SpaceX’s reported capital expenditure covers its operating segments. The measures should not be treated as fully comparable measures of total economic investment.
Revenue growth: Different starting points
SpaceX’s 161% revenue growth was considerably faster than Netflix’s 11.8% increase. However, the difference reflects more than relative business momentum.
SpaceX’s growth was heavily influenced by the rapid expansion of its SI segment, the contribution of Cursor and new cloud services agreements. Its third-quarter 2025 revenue base was also substantially smaller than its latest quarterly revenue.
Netflix’s revenue base was more mature, and its reported growth was primarily driven by subscription revenue, membership changes, pricing and advertising.
High growth can create significant opportunities, but it also increases the importance of evaluating the source and quality of that growth. Investors should determine whether expansion comes from recurring customer relationships, acquisitions, pricing, temporary effects or a combination of factors.
For Netflix, retention and subscription value remain important indicators. For SpaceX, the durability of cloud contracts, subscriber expansion and the economics of computing infrastructure are central considerations.
Operating margins: Efficiency and business mix
Netflix’s 34.6% operating margin was higher than SpaceX’s approximately 19.2% margin.
Netflix’s operating model can distribute the costs of content and technology across a large global subscriber base. Once certain content and platform investments are in place, additional revenue may support operating leverage, although content spending and marketing requirements can still be substantial.
SpaceX’s consolidated margin reflects a different combination of businesses. Its Connectivity segment generated significant operating income, while the Space segment was close to operating break-even and SI continued to invest heavily in infrastructure.
These segment differences explain why consolidated margin should not be treated as a complete measure of the underlying economics of each operation.
Netflix’s higher margin does not automatically make it the better investment, just as SpaceX’s faster revenue growth does not establish that its expansion will produce superior long-term returns. Valuation, future cash generation, risks and the durability of earnings all matter.
Net income and adjusted earnings measures
SpaceX reported higher net income than Netflix during the quarter, despite its lower operating margin. The difference reflects the fact that net income includes items beyond operating income.
SpaceX reported significant interest income and other income during the period, which contributed to its net income result. Its net income should therefore be examined alongside operating income and the reconciliation of adjusted EBITDA.
Netflix’s reported net income was also affected by items outside ordinary operating performance, but its operating income and margin provide useful evidence of its underlying entertainment business performance.
For both companies, a sound earnings analysis separates operating results from financing effects, acquisition-related items, taxes and other non-operating factors.
10. Stock Market Implications: What Investors Should Examine
The latest Netflix and SpaceX earnings provide information that can help investors evaluate business performance, but they do not independently determine whether either company’s shares are attractively valued.
A stock market assessment requires a comparison between expected future financial performance and the price investors are being asked to pay for that performance.
Strong results may already be reflected in a share price. Conversely, a company can report positive earnings growth and still face pressure if investors expected even stronger performance or become less confident about future guidance.
Expectations versus reported results
Investors commonly assess quarterly earnings against three reference points: the previous year’s performance, management’s guidance and market expectations.
The first comparison shows whether the business is growing. The second indicates whether management is delivering against its own outlook. The third helps explain how the results compare with what investors had anticipated.
Netflix reported third-quarter revenue broadly consistent with its forecast and operating margin above its forecast, partly because of expense timing. Its full-year guidance remained focused on revenue growth and higher operating margin, although its advertising and free cash flow expectations were revised downward.
SpaceX reported a substantial year-over-year increase in revenue and a return to positive operating income and net income. However, the implications of its results depend on how investors evaluate its unusually rapid SI expansion, capital requirements and future returns.
The two companies should therefore be assessed according to the financial expectations relevant to their respective business models.
Revenue quality and recurring demand
For Netflix, the recurring subscription model is a key element of its revenue profile. Investors can assess membership retention, pricing, advertising growth and content engagement to understand how durable the revenue base may be.
For SpaceX, the mix of consumer subscriptions, enterprise and government contracts, launch services and computing infrastructure creates several different revenue streams. Each has its own renewal patterns, cost structures and exposure to investment cycles.
Recurring revenue can improve visibility, but it does not eliminate commercial risk. Subscribers can cancel, contracts can change, customer demand can weaken, and new competitors can affect pricing.
The relevant question is not simply how much revenue a company reports, but how reliably that revenue can be maintained and converted into profit and cash.
Valuation and earnings growth
A company’s valuation often reflects expectations about future earnings and cash flow. Investors may use measures such as price-to-earnings ratios, enterprise value relative to operating earnings, free cash flow yield and other metrics, depending on the business.
However, no single ratio provides a complete valuation assessment. The suitability of a measure depends on the company’s accounting, capital structure, investment needs and earnings profile.
Netflix’s established operating profitability and subscription model make its ability to sustain revenue growth, margin performance and free cash flow important valuation considerations.
SpaceX’s rapidly changing business mix makes it particularly important to distinguish established segment economics from emerging growth opportunities. Investors need to assess whether new infrastructure and computing capacity can produce returns that justify the associated investment.
A fast-growing company may warrant a different valuation framework from a mature business, but rapid growth does not remove the need for evidence of economic returns.
What the stock market may focus on next
For Netflix, important areas to monitor include the pace of advertising expansion, subscription retention, viewing engagement, content performance and the delivery of full-year guidance.
For SpaceX, key questions include the sustainability of SI revenue, Starlink subscriber economics, the profitability of the Space segment, capital expenditure and the return generated by new computing infrastructure.
Investors should also consider broader economic conditions, interest rates, competitive developments and changes in market risk appetite. These factors can influence valuations independently of company-specific earnings.
The third-quarter reports provide useful evidence about operating performance, but they are not sufficient on their own to establish an appropriate share price or predict future market returns.
11. Risks and Uncertainties Affecting Future Growth
Both Netflix and SpaceX face risks that could affect their future earnings and growth. Their exposure differs because their businesses rely on different customers, technologies and investment cycles.
Netflix: Content, retention and advertising execution
Netflix competes for consumer attention with streaming platforms, traditional entertainment providers, social media and other forms of leisure.
If its content offering becomes less attractive, member engagement and retention could weaken. Pricing increases could also affect customer decisions if subscribers believe the service no longer offers sufficient value.
Content production and licensing introduce additional uncertainty. Production delays, unsuccessful releases, changes in audience preferences and higher content costs can affect financial performance.
Advertising creates another opportunity but also another execution challenge. Netflix’s revised advertising revenue forecast illustrates that product development and market expansion may take longer than anticipated.
The company must also ensure that advertising does not undermine the viewing experience that supports its subscription business.
SpaceX: Capital intensity and execution
SpaceX’s infrastructure requirements are a major consideration. Its third-quarter capital expenditure of $19.593 billion demonstrates the scale of its investment programme.
If customer demand, capacity utilization or pricing fails to meet expectations, the returns on these investments could be lower than anticipated. Large infrastructure programmes can also encounter technical, regulatory, operational and scheduling challenges.
The Space segment requires continued research and development, particularly in relation to Starship. Progress in launch capability can support future business opportunities, but development expenditure and operational milestones remain uncertain.
Connectivity also requires continued network investment. Subscriber growth must be considered alongside ARPU, operating costs, equipment, capacity and the economics of serving different markets.
In SI, the rapid expansion of revenue must be evaluated alongside the costs of computing infrastructure, software development, acquisitions and customer delivery.
Financial reporting and forecast risk
Neither company’s management forecasts should be treated as guaranteed outcomes.
Netflix explicitly notes that actual results may differ from forward-looking statements because of factors including competition, customer retention, content performance, advertising adoption and macroeconomic conditions.
SpaceX’s growth plans similarly depend on customer demand, operational execution, technology development and the financial performance of its different business segments.
Investors should also distinguish GAAP measures from non-GAAP measures. Adjusted EBITDA and free cash flow can provide useful supplemental information, but their definitions and limitations matter. They should not be used as substitutes for net income, operating income or operating cash flow.
A disciplined assessment considers both the opportunities and the conditions required for those opportunities to produce sustainable financial returns.
12. What Investors Should Monitor in the Coming Quarters
The next reporting periods will help establish whether the third-quarter results represent durable improvements or a combination of favorable operating conditions, investment timing and changes in business mix.
For Netflix, the most useful indicators extend beyond quarterly revenue. Investors should monitor whether the company maintains healthy retention, sustains operating margins and delivers on its advertising strategy. Content performance and viewing engagement will also matter because they influence the value subscribers receive from the service.
The company’s fourth-quarter revenue forecast of $13.442 billion provides a specific benchmark against which subsequent results can be assessed. Its projected operating margin of 26.0% should be considered in light of the company’s explanation of organizational changes and the timing of expenses.
For full-year 2026, Netflix expects revenue of $51.1 billion and an operating margin of 31.5%. Its approximately $12 billion free cash flow forecast also provides a useful measure of whether earnings translate into cash generation after capital expenditure.
SpaceX requires a different set of indicators. Revenue growth across the Space, Connectivity and SI segments should be examined separately, particularly as SI represents a growing share of the company’s reported revenue.
The company will also need to demonstrate that computing capacity generates sufficient customer demand and operating returns to support its investment programme. Capital expenditure, operating cash flow and the development of the Starship programme will remain relevant to the financial assessment.
Connectivity performance deserves continued attention as well. Starlink’s growing subscriber base is encouraging, but investors should assess subscriber additions alongside ARPU, enterprise revenue, operating income and the cost of expanding the network.
For both companies, the most informative results will be those that show how revenue growth translates into durable profitability and cash generation. Quarterly figures are important, but consistent performance across multiple periods offers a stronger basis for evaluating long-term business quality.
Conclusion: Netflix and SpaceX Offer Different Growth Profiles
Netflix and SpaceX delivered strong third-quarter 2026 financial results, although the drivers and implications of their growth differ considerably.
Netflix generated $12.874 billion in revenue, $4.459 billion in operating income and $3.664 billion in net income. Its results reflected subscription growth, pricing, advertising and continued investment in entertainment. The company also reported higher operating margins and substantial free cash flow, while identifying slower-than-expected advertising development as a factor affecting its outlook.
SpaceX generated $14.575 billion in revenue, $2.791 billion in operating income and $4.404 billion in net income. Its 161% revenue growth was driven primarily by the expansion of Super Intelligence and Connectivity. However, its substantial capital expenditure highlights the importance of converting infrastructure investment into sustainable returns.
The comparison demonstrates that revenue growth, operating profitability and investment requirements must be evaluated together. Netflix’s more established subscription model supports a different financial profile from SpaceX’s combination of connectivity, launch services and computing infrastructure.
For stock market investors, neither company’s reported results establish a guaranteed future outcome. The relevant questions concern the durability of revenue, the quality of earnings, the efficiency of capital allocation and the ability to meet future guidance.
Netflix’s progress will depend on maintaining customer value while developing new revenue streams. SpaceX’s continued expansion will depend on the commercial performance of its infrastructure and its ability to manage the financial demands of rapid growth.
The next reporting periods should provide further evidence of how effectively both companies translate their strategies into sustainable financial performance.
A Note to Our Readers: At Quantara Insights, our goal is to help you stay informed and better understand the business and financial stories shaping the world around us. This article is for general informational and educational purposes only and should not be taken as financial or investment advice. While we strive to share accurate, reliable, and up-to-date information, business results and market conditions can change, and future performance is never guaranteed. We encourage you to do your own research and speak with a qualified financial adviser before making investment decisions. Thank you for reading and being part of the Quantara Insights community.