



Table of Contents
- July PPI Was Unchanged
- What Drove the July PPI Reading?
- PPI and the Inflation Outlook
- Why the Goods and Services Split Matters
- Energy Prices Were a Major July Factor
- Food Prices Pointed Lower
- Underlying PPI Remained Firm
- Intermediate Demand Shows Continued Cost Pressure
- What PPI Says About Economic Growth
- PPI, Business Margins and Pricing Power
- What the July Data Means for Investors
- PPI Compared With Consumer Inflation
- What to Watch Next
- What the July PPI Report Does Not Tell Us
- Why the 12-Month Figures Matter
- A Closer Look at Services
- Construction Prices Add Another Layer
- A Balanced Reading of July PPI
- Frequently Asked Questions About PPI July 2026
- What happened to PPI in July 2026?
- What does PPI measure?
- Did energy prices fall in July?
- Did food prices fall in July?
- What happened to services prices?
- Does PPI predict inflation?
- What does July PPI mean for economic growth?
- Why is the core PPI measure important?
- Were intermediate prices still rising?
- Why did the headline PPI remain unchanged?
- Should investors focus only on the headline PPI number?
- What should businesses watch after the July report?
- Conclusion: July PPI Shows a Mixed Price Environment
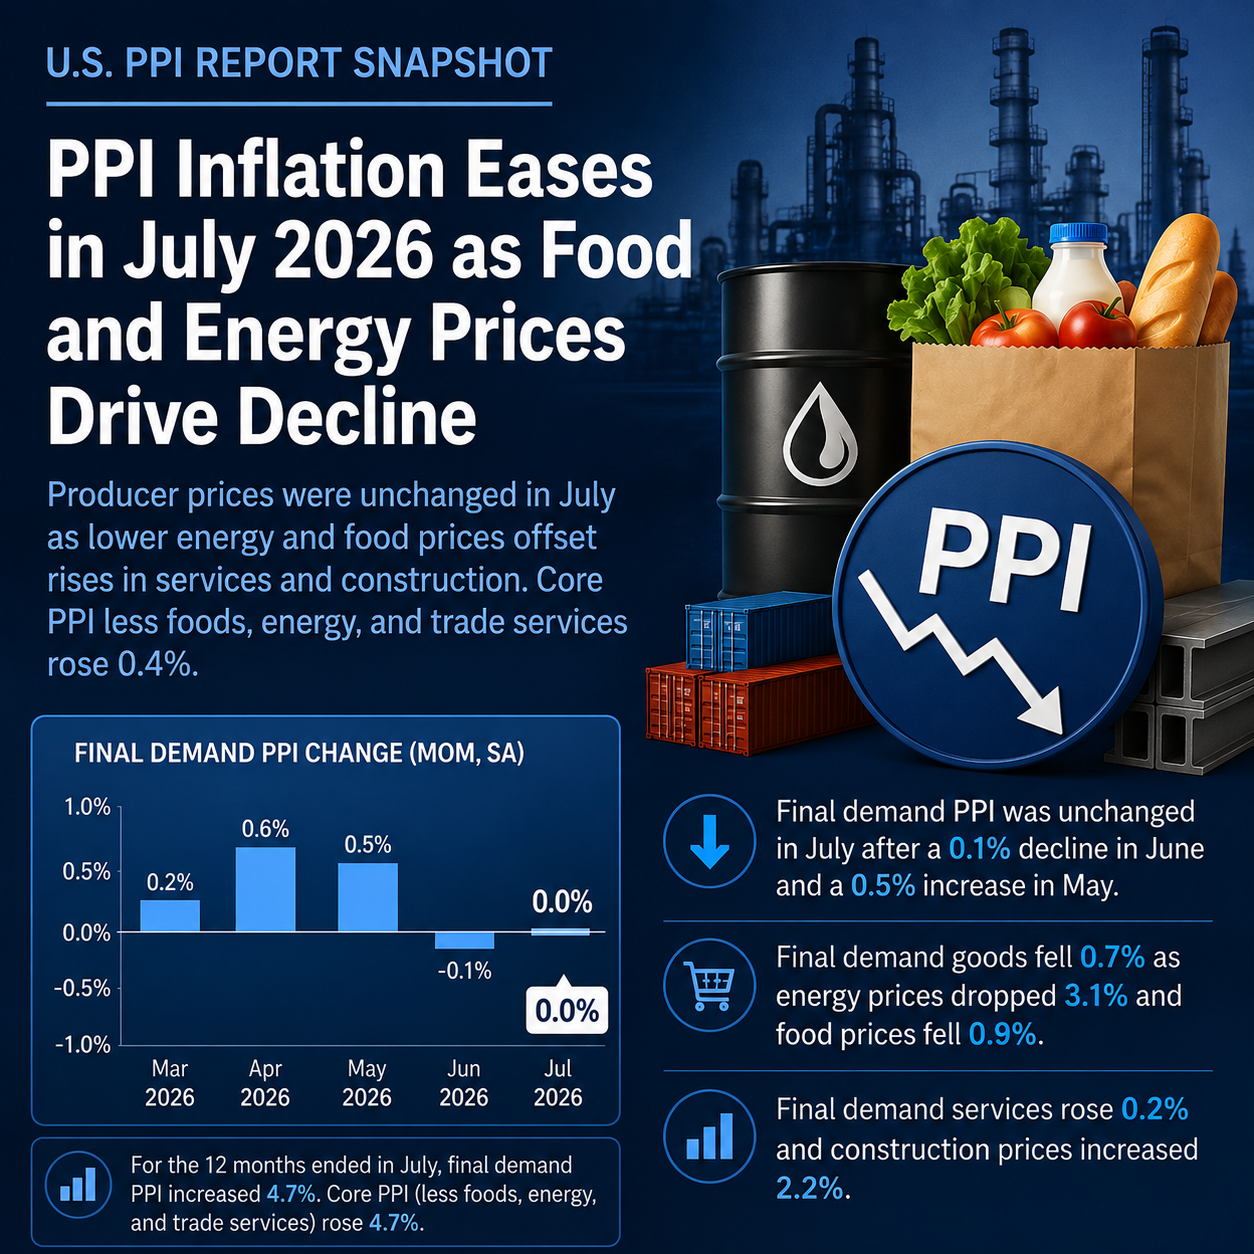
PPI was unchanged in July 2026, according to the latest U.S. Bureau of Labor Statistics report, marking a pause in overall producer-price growth after a 0.1% decline in June and a 0.5% increase in May. The headline result, however, masks a notable shift beneath the surface: energy and food prices moved lower, while services and construction prices increased. The combination offers a more nuanced view of inflation, business costs and the outlook for economic growth.
The July PPI report is important because producer prices can provide information about cost pressures facing businesses before those pressures potentially reach consumers. The latest figures do not point to a broad acceleration in producer prices, but they also do not suggest that all inflationary pressure has disappeared.
For businesses, the distinction between goods, energy, food and services remains important. For investors and policymakers, the composition of the PPI reading may be more informative than the unchanged headline number.
The July report showed that final demand prices were unchanged on a seasonally adjusted basis. Final demand goods fell 0.7%, while final demand services rose 0.2%. Final demand construction increased 2.2%, providing another offset to the decline in goods.
At the same time, the index for final demand less foods, energy and trade services increased 0.4% in July. On a 12-month basis, that measure was up 4.7%.
That combination makes the July PPI report less straightforward than the headline suggests.
July PPI Was Unchanged
The central result from the July PPI report is simple: producer prices for final demand were unchanged during the month on a seasonally adjusted basis.
That followed a 0.1% decline in June and a 0.5% increase in May. On an unadjusted basis, final demand prices were 4.7% higher over the 12 months through July.
The unchanged monthly reading means the overall level of prices received by producers did not move materially in July after seasonal adjustment. But the components moved in different directions.
Final demand goods declined 0.7%. Final demand services increased 0.2%. Construction prices rose 2.2%.
This divergence is central to understanding the July PPI report.
A headline reading of zero could otherwise be interpreted as a broad stabilization of producer prices. The underlying detail shows something more complicated. Goods prices weakened, largely because of lower energy and food prices, while several service categories recorded increases.
The report therefore provides evidence of continued price movement rather than a complete absence of inflationary pressure.
For companies, the distinction matters because service costs and goods costs do not necessarily move together. A manufacturer may benefit from lower fuel costs while facing higher prices for certain services. A retailer may see lower wholesale costs in some food categories while encountering higher margins or service-related expenses elsewhere.
What Drove the July PPI Reading?
The July PPI result was shaped by three major movements: lower goods prices, higher services prices and a substantial increase in construction prices.
Final demand goods declined 0.7% in July following a 1.4% decline in June. Energy was the largest contributor to that decrease, with final demand energy prices falling 3.1%.
Final demand food prices also declined, falling 0.9%.
By contrast, final demand services increased 0.2%, after rising 0.5% in June.
Final demand construction prices increased 2.2%.

The combination left the headline PPI unchanged.
This is significant because the headline figure alone does not capture the differences between commodity-sensitive areas and service-heavy parts of the economy.
Energy Prices Fell Sharply
Energy was one of the most important factors behind the July PPI result.
Final demand energy prices decreased 3.1% during the month. Gasoline prices declined 5.7%, accounting for more than half of the decrease in final demand goods.
Other energy-related categories also weakened. Prices for diesel fuel, jet fuel and residual fuels declined.
The movement in energy prices can have broader economic consequences because energy is an input into transportation, manufacturing, logistics, agriculture and many service activities.
Lower energy prices can reduce direct operating costs for businesses. They can also reduce transportation expenses and some input costs further down the supply chain.
However, the July PPI report should not be interpreted as evidence that energy-related inflation will necessarily remain subdued. Energy markets can be volatile, and one month’s movement does not establish a long-term trend.
The report provides a snapshot of July conditions rather than a guarantee of what energy prices will do in subsequent months.
Food Prices Also Declined
Food was another important source of downward pressure in the July PPI data.
Final demand food prices declined 0.9% during July. Fresh and dry vegetables were among the categories contributing to the decline.
At the intermediate level, processed foods and feeds prices fell 0.5%.
The food data is particularly relevant because changes in food costs can affect producers, wholesalers, retailers and consumers at different points in the supply chain.
Lower producer prices for selected food products can reduce cost pressures for businesses further downstream. But the relationship between producer prices and consumer prices is not one-to-one.
Retail prices also reflect transportation, labor, packaging, rent, distribution, retail margins and other expenses. As a result, a decline in food-related PPI does not automatically translate into an equivalent decline in supermarket prices.
Still, the direction of food prices in July was notable and helped offset increases elsewhere in the producer-price system.
Services Provided an Offset
While goods prices declined, services moved higher.
Final demand services prices increased 0.2% in July after rising 0.5% in June.
The main source of the July increase was final demand services excluding trade, transportation and warehousing, which increased 0.6%.
Portfolio management prices rose 6.5%, making the category a particularly significant contributor to the monthly increase.
Margins for several retail and wholesale activities also moved higher, including food and alcohol retailing and wholesaling, automobile and parts retailing, and lawn, garden and farm equipment retailing.
The report therefore shows that service-related price pressure remained relevant even as goods, food and energy prices declined.
That distinction matters when evaluating the inflation outlook.
PPI and the Inflation Outlook
The relationship between PPI and inflation is important, but it requires careful interpretation.
The Producer Price Index measures changes in prices received by producers for domestically produced goods, services and construction. It is therefore a measure of price movement from the seller’s perspective.
Consumer inflation measures prices from the purchaser’s perspective.
A rise in PPI can indicate that businesses are facing higher prices for goods or services they sell. In some cases, businesses may pass part of those increases through to customers. In other cases, they may absorb higher costs through lower profit margins, change suppliers, adjust product specifications or find other ways to manage expenses.
That means producer-price increases do not automatically become consumer inflation.
The July PPI data provides a mixed signal. The headline index was unchanged, and goods prices declined. Energy and food also moved lower. But services remained positive, and the measure excluding foods, energy and trade services increased 0.4% during July.
That combination suggests that inflationary pressure was uneven.
The 12-month increase of 4.7% in final demand prices also shows that the absence of monthly growth in July should not be confused with an absence of price increases over the longer period.
The broader inflation picture therefore remains dependent on how the various components evolve in coming months.
Why the Goods and Services Split Matters
One of the clearest messages from the July PPI report is the difference between goods and services.
Goods prices can be particularly sensitive to energy, commodity prices, transportation costs, supply conditions and international markets.
Services prices can be influenced more heavily by labor costs, financial conditions, business demand, property expenses and other operating costs.
In July, final demand goods prices fell 0.7%, while final demand services prices rose 0.2%.
This divergence helps explain why a flat headline PPI does not necessarily mean that businesses are experiencing flat costs across the board.
For companies dependent on fuel or commodity inputs, July may have brought some relief. For service businesses, the environment may have remained more challenging.
This distinction also matters for investors. A temporary decline in energy prices can have a significant effect on the headline index without necessarily changing the underlying direction of service inflation.
That is why investors and economists often examine multiple measures rather than relying on the headline PPI alone.
Energy Prices Were a Major July Factor
Energy had a particularly strong influence on July’s producer-price data.
Final demand energy prices declined 3.1%, while gasoline prices fell 5.7%.
At the intermediate level, processed energy goods prices fell 3.1%. Unprocessed energy materials dropped 7.4%.
Crude petroleum prices fell 11.9% within unprocessed goods for intermediate demand.
These movements demonstrate how changes in energy markets can affect different stages of production.
The impact is not limited to fuel producers. Transportation companies, manufacturers, wholesalers and retailers can all be exposed to energy costs.
When energy prices decline, businesses may gain some flexibility in managing operating expenses. But the benefit varies depending on how quickly input prices change and how much of the saving is passed through the supply chain.
Energy also has an important role in inflation expectations because consumers and businesses observe fuel prices directly.
Still, the July PPI data should be treated as a monthly observation rather than a forecast.
Food Prices Pointed Lower
Food prices also contributed to the softer goods reading.
The final demand food index declined 0.9% in July, while prices for processed foods and feeds used in intermediate demand decreased 0.5%.
Fresh vegetables were among the categories that recorded lower prices.
At the same time, the intermediate-demand data showed that not every food-related category moved lower. Unprocessed foodstuffs and feedstuffs increased 0.7%.
This variation highlights the complexity of food supply chains.
Raw agricultural commodities can move differently from processed products. Processors and retailers may also face different combinations of labor, transportation, packaging and energy expenses.
As a result, the food component of PPI should not be viewed as a direct proxy for grocery-store inflation.
The July figures nevertheless provide some evidence of easing pressure in several food-related producer categories.
Underlying PPI Remained Firm
One of the most important details in the July PPI release was the increase in final demand prices excluding foods, energy and trade services.
That index rose 0.4% in July after increasing 0.1% in June.
Over the 12 months through July, the index increased 4.7%.
This measure is useful because food and energy prices can be volatile. Removing them can provide a different view of price movements in other parts of the economy.
The July increase suggests that the broader producer-price environment remained firm even as energy and food prices declined.
It would be premature to interpret the figure as evidence of a new acceleration in inflation based on one month. But it does indicate that the flat headline PPI reading did not reflect uniform weakness across the economy.
For businesses, that means cost management remains relevant even when certain commodity prices are moving lower.
Intermediate Demand Shows Continued Cost Pressure
The July PPI report also contains important information about intermediate demand, which tracks prices for goods and services used as inputs into production.
Processed goods for intermediate demand declined 0.6% in July.
Unprocessed goods declined 1.8%.
Services for intermediate demand increased 0.5%.
This again illustrates the split between goods and services.
Processed energy goods declined 3.1%, while processed foods and feeds fell 0.5%. Meanwhile, prices for services excluding trade, transportation and warehousing rose 0.6%.
Over the 12 months through July, processed goods for intermediate demand were up 9.9%.
Unprocessed goods for intermediate demand increased 7.1% over the same period.
Intermediate services were up 5.1%.
These annual figures indicate that input prices remained considerably higher than a year earlier even though several categories recorded monthly declines.
The data therefore offers an important warning against focusing exclusively on the monthly headline PPI.
Stage 4 Intermediate Demand
Stage 4 intermediate demand prices increased 0.6% in July.
Services inputs rose 0.9%, while goods inputs increased 0.3%.
The index was 6.7% higher over the 12 months through July.
Higher prices for portfolio management, machinery and equipment parts and supplies wholesaling, food and alcohol wholesaling, management consulting and other services outweighed declines in gasoline, diesel fuel and gross rents for retail properties.
This is another example of how lower energy costs can coexist with higher service-related costs.
Stage 3 Intermediate Demand
Stage 3 intermediate demand prices edged down 0.1% in July.
Goods inputs declined 0.2%, while services inputs were unchanged.
Over 12 months, the index increased 5.8%.
The July decline reflected lower prices for several inputs, including diesel fuel, slaughter cattle, raw milk and certain financial services.
Prices for grains and several services increased.
Stage 2 Intermediate Demand
Stage 2 intermediate demand prices declined 1.0% in July after falling 1.7% in June.
Goods inputs dropped 2.8%, while services inputs increased 0.3%.
The index was 7.6% higher over the year.
Lower crude petroleum, natural gas liquids, diesel fuel and jet fuel prices contributed to the monthly decline.
The data reinforces the importance of energy prices in the producer-price system.
Stage 1 Intermediate Demand
Stage 1 intermediate demand prices edged down 0.1% in July.
Goods inputs declined 0.6%, while services inputs rose 0.5%.
The index was 9.7% higher over the 12 months through July.
This annual increase is notable because it indicates that businesses remained exposed to elevated input costs despite the softer monthly reading.
What PPI Says About Economic Growth
The connection between PPI and economic growth is indirect.
Producer prices do not measure economic output. Instead, they provide information about pricing conditions faced by businesses.
That information can still matter for growth because persistent input-cost increases can influence corporate margins, investment decisions, hiring and final prices.
If businesses face sharply higher costs but cannot raise selling prices, margins can come under pressure.
If businesses successfully pass those costs to customers, consumer inflation can remain elevated.
If input costs decline, companies may have more room to protect margins or reduce prices.
The July PPI data presents a mixed environment.
Energy and food costs declined, which may reduce pressure in some industries. Services prices remained firm, however, and several intermediate-demand measures continued to show substantial annual increases.
That combination suggests the implications for growth depend heavily on the industry.
Energy-intensive businesses may benefit from lower fuel costs. Service providers may continue to face cost pressures. Manufacturers can see benefits from some cheaper inputs while still dealing with higher prices for other materials and services.
The July report therefore does not provide a single direction for the entire economy.
Instead, it offers a picture of different cost pressures moving at different speeds.
PPI, Business Margins and Pricing Power
Businesses ultimately have several choices when producer prices change.
They can absorb higher costs, raise prices, reduce other expenses, adjust product offerings or accept lower margins.
The ability to pass costs through to customers depends partly on pricing power.
A company operating in a highly competitive market may have limited ability to increase prices when input costs rise. A company with stronger pricing power may be better positioned to protect margins.
The July PPI data is relevant because service prices continued to rise while goods, food and energy prices declined.
This creates different operating conditions across sectors.
Retailers may benefit from lower prices for certain goods while facing changes in wholesale and service margins. Manufacturers may benefit from lower fuel costs but still face higher prices for specific materials or services.
For investors, the important issue is not simply whether PPI increased or decreased. The more useful question is where the price changes occurred and how those movements affect company earnings.
What the July Data Means for Investors
Investors may use PPI data as one part of a broader assessment of inflation, interest rates, corporate margins and economic growth.
The July release provides several signals worth monitoring.
First, the headline index was unchanged.
Second, goods prices declined.
Third, energy prices fell sharply.
Fourth, food prices also declined.
Fifth, services prices increased.
Sixth, the measure excluding foods, energy and trade services increased 0.4%.
Seventh, intermediate-demand prices remained significantly higher than a year earlier in several categories.
Taken together, these figures suggest a producer-price environment that is neither uniformly inflationary nor uniformly disinflationary.
For investors, the composition matters.
Lower energy prices could provide some support for businesses with high fuel exposure. Lower food prices may also reduce costs for certain producers and retailers.
But persistent service inflation could continue to affect companies with significant exposure to labor, financial, consulting, distribution or other service expenses.
The data can also be relevant to expectations around monetary policy, although PPI is only one input into broader economic and inflation assessments.
PPI Compared With Consumer Inflation
The distinction between PPI and consumer inflation is essential.
PPI measures price changes from the perspective of producers and sellers.
Consumer inflation measures price changes experienced by purchasers.
The two indicators are related but not interchangeable.
Suppose a manufacturer faces a higher cost for a particular input. The manufacturer may pass the entire increase to customers, pass through only part of it or absorb it.
A retailer then has additional costs of its own, including transportation, labor, rent and other expenses.
The final consumer price can therefore differ significantly from the producer price.
This is why the July PPI report should not be treated as a direct forecast of the next consumer inflation reading.
It is better viewed as one piece of information about the price environment across the production and distribution system.
The July report’s combination of lower food and energy prices with firmer services prices is particularly useful because it shows why broad inflation analysis requires more than one headline number.
What to Watch Next
The next PPI report will help determine whether July’s movements were temporary or part of a more persistent trend.
Several areas deserve attention.
Energy
Energy prices were a major source of downward pressure in July. Future movements in gasoline, diesel, crude petroleum and other energy categories will influence the headline PPI.
Food
Food prices declined in several important categories. The next reports will show whether the July decline persists or reverses.

Services
Services remain one of the most important areas to monitor because they increased while goods prices declined.
Underlying Producer Prices
The 0.4% monthly increase in final demand prices excluding foods, energy and trade services deserves attention in future releases.
Intermediate Costs
Annual increases in intermediate-demand categories remain significant. Businesses may continue to face higher input costs even when monthly price movements are soft.
Economic Growth
The relationship between producer prices and growth will depend partly on whether businesses can maintain margins while managing costs.
What the July PPI Report Does Not Tell Us
It is also important to recognize the limits of the July PPI data.
The report does not provide a direct forecast for consumer prices.
It does not establish the future path of interest rates.
It does not measure overall economic growth.
It does not show that lower energy prices will necessarily persist.
And it does not mean that every business is experiencing lower costs.
The data is best understood as a detailed monthly snapshot of producer-price conditions.
That distinction is particularly important when markets are reacting to individual economic releases. A single monthly figure can be informative without being decisive.
The broader trend will become clearer as subsequent reports provide more observations.
Why the 12-Month Figures Matter
The monthly PPI data captures short-term changes, but the 12-month figures provide useful context.
Final demand prices increased 4.7% over the 12 months through July on an unadjusted basis.
Final demand prices excluding foods, energy and trade services also increased 4.7%.
Processed goods for intermediate demand increased 9.9%.
Unprocessed goods for intermediate demand increased 7.1%.
Intermediate services increased 5.1%.
Stage 4 intermediate demand increased 6.7%.
Stage 3 increased 5.8%.
Stage 2 increased 7.6%.
Stage 1 increased 9.7%.
These figures show that the producer-price system continued to record meaningful annual increases even though some monthly indexes declined.
The distinction between monthly and annual changes is critical.
A decline in a single month does not erase the accumulated increase over the preceding year.
For businesses, the annual numbers may be particularly relevant when assessing budgets, contracts, procurement costs and pricing decisions.
A Closer Look at Services
The service component of PPI deserves particular attention because it was one of the areas where prices continued to increase.
Final demand services rose 0.2% in July.
The index excluding trade, transportation and warehousing increased 0.6%.
Portfolio management prices rose 6.5%.
At the same time, transportation and warehousing services declined 1.8%, while trade services declined 0.1%.
This again demonstrates that “services” is not a single uniform category.
Financial services, transportation, wholesale services and other business services can move in different directions depending on demand and market conditions.
For companies, that variation can influence operating costs in different ways.
A logistics-heavy business may benefit from lower transportation costs while facing higher financial or consulting expenses.
The July PPI data therefore supports a sector-by-sector approach to interpreting inflation and business costs.
Construction Prices Add Another Layer
Construction prices rose 2.2% for final demand in July.
That was a substantial monthly increase compared with the unchanged headline PPI.
Construction can be sensitive to material prices, labor costs, financing conditions, project demand and other factors.
The July increase means that the overall producer-price picture cannot be described simply as a decline in cost pressures.
Instead, the data shows significant differences across economic activities.
For businesses involved in construction or dependent on construction services, the July movement may have different implications than the lower prices recorded in energy or food.
This is another reason to examine the components of PPI rather than relying only on the headline number.
A Balanced Reading of July PPI
The most reasonable interpretation of the July PPI report is that producer-price pressure remained uneven.
The headline index was unchanged.
Goods prices declined 0.7%.
Energy prices fell 3.1%.
Food prices declined 0.9%.
Services prices increased 0.2%.
Construction prices rose 2.2%.
The measure excluding foods, energy and trade services increased 0.4%.
These figures tell a more useful story together than individually.
The July report does not point to a broad acceleration in producer prices. At the same time, it does not indicate that all underlying cost pressures have disappeared.
The decline in energy and food prices provided meaningful relief in goods.
Services remained firmer.
Intermediate costs remained elevated on a 12-month basis.
For policymakers and investors, that suggests continued attention to the composition of inflation rather than simply the direction of the headline index.
For businesses, the message is similarly practical: cost conditions vary significantly by sector and input.
Frequently Asked Questions About PPI July 2026
What happened to PPI in July 2026?
PPI was unchanged in July 2026 on a seasonally adjusted basis. That followed a 0.1% decline in June and a 0.5% increase in May. On an unadjusted basis, final demand prices were 4.7% higher over the 12 months through July.
What does PPI measure?
PPI measures changes over time in prices received by domestic producers for goods, services and construction. It measures price changes from the seller’s perspective rather than the purchaser’s perspective.
Did energy prices fall in July?
Yes. Final demand energy prices declined 3.1% in July. Gasoline prices fell 5.7%, making energy one of the largest sources of downward pressure on the July PPI reading.
Did food prices fall in July?
Yes. Final demand food prices declined 0.9% in July. The report also showed a 0.5% decline in processed foods and feeds for intermediate demand.
What happened to services prices?
Final demand services prices increased 0.2% in July after rising 0.5% in June. Services excluding trade, transportation and warehousing increased 0.6%.
Does PPI predict inflation?
PPI can provide useful information about producer-price pressures, but it does not directly predict consumer inflation. Businesses can absorb higher costs, pass them through to customers or adjust their margins, so producer prices and consumer prices can move differently.
What does July PPI mean for economic growth?
The July PPI report provides indirect information about growth because producer prices can influence business margins, investment and pricing decisions. The data does not, by itself, provide a direct measure or forecast of economic growth.
Why is the core PPI measure important?

The measure excluding foods, energy and trade services increased 0.4% in July. It can help analysts assess price movements outside some of the more volatile categories.
Were intermediate prices still rising?
Yes. Although several intermediate-demand categories declined in July, many remained substantially higher than a year earlier. Processed goods for intermediate demand were up 9.9% over 12 months, while stage 1 intermediate demand increased 9.7%.
Why did the headline PPI remain unchanged?
Lower prices for final demand goods, particularly energy and food, were offset by increases in final demand services and construction. The result was an unchanged headline index.
Should investors focus only on the headline PPI number?
No. The composition of the report is important. Investors may want to consider goods, services, food, energy, construction, underlying measures and intermediate-demand prices to understand the broader producer-cost environment.
What should businesses watch after the July report?
Businesses should monitor energy, food, services and intermediate input prices in future releases. Companies may also want to consider how producer-price changes affect margins, procurement costs and pricing decisions.
Conclusion: July PPI Shows a Mixed Price Environment
The July PPI report provides a relatively measured picture of US producer prices.
The headline index was unchanged, but the underlying components moved in different directions. Goods prices declined, led by a 3.1% drop in final demand energy prices and a 0.9% decline in final demand food prices. Gasoline prices fell 5.7%.
Services moved in the opposite direction, increasing 0.2%, while construction prices rose 2.2%.
The measure excluding foods, energy and trade services increased 0.4%, indicating that the softer headline number did not represent a broad decline across every category.
The annual figures also remain important. Final demand prices were up 4.7% over the 12 months through July, while several intermediate-demand measures posted larger annual increases.
For the inflation outlook, the July PPI report therefore offers a mixed signal rather than a simple directional message.
For businesses, lower energy and food prices could provide relief in selected areas, while service and intermediate costs remain important considerations.
For investors, the report reinforces the value of looking beneath the headline number.
The key takeaway is straightforward: PPI was flat in July, but the underlying price environment remained uneven, with lower food and energy costs offset by firmer services and construction prices.
The next releases will help determine whether the July movements represent a temporary shift or a more persistent change in producer-price trends.