





Table of Contents
- What the August 2026 CPI Report Shows
- CPI Increased 3.4% Over the Past Year
- Core CPI Provides a Different View of Inflation
- Energy Prices Were a Major Driver of August CPI
- Shelter Continued to Increase
- Airfares Increased 2.7% in August
- Motor Vehicle Insurance Prices Fell Again
- Medical Care Prices Declined in August
- Food Prices Increased Only Slightly
- Communication and Education Also Increased
- What the August CPI Means for Consumers
- CPI and Real Earnings Tell Different Parts of the Story
- Real Hourly Earnings Declined 0.1% in August
- Real Weekly Earnings Increased
- Production and Nonsupervisory Workers Saw Similar Pressure
- Why the Monthly CPI Increase Matters
- August CPI Compared With July
- The Annual CPI Picture Is Also Highly Uneven
- What Businesses Should Watch in the CPI Data
- What Consumers Should Watch Next
- How to Read the CPI Without Overreacting to One Month
- CPI, Core CPI and the Broader Inflation Trend
- Frequently Asked Questions About the August 2026 CPI
- What was the CPI increase in August 2026?
- What was Core CPI in August 2026?
- What happened to motor vehicle insurance in August 2026?
- How much did airfares increase in August 2026?
- Did medical care prices increase in August 2026?
- How much did gasoline prices increase in August 2026?
- Did shelter prices increase in August 2026?
- Did real wages increase in August 2026?
- What was the average hourly wage in August 2026?
- What does the August CPI report mean for consumers?
- Key Takeaways From the August 2026 CPI Report
- Conclusion: What the August 2026 CPI Data Tell Us
CPI data for August 2026 show that consumer prices increased at a faster monthly pace than in July, while the annual inflation rate remained unchanged at 3.4%. The latest Consumer Price Index report presents a mixed picture across major household expenses, with energy, airfares, shelter and several other categories moving higher while motor vehicle insurance and medical care declined during the month.
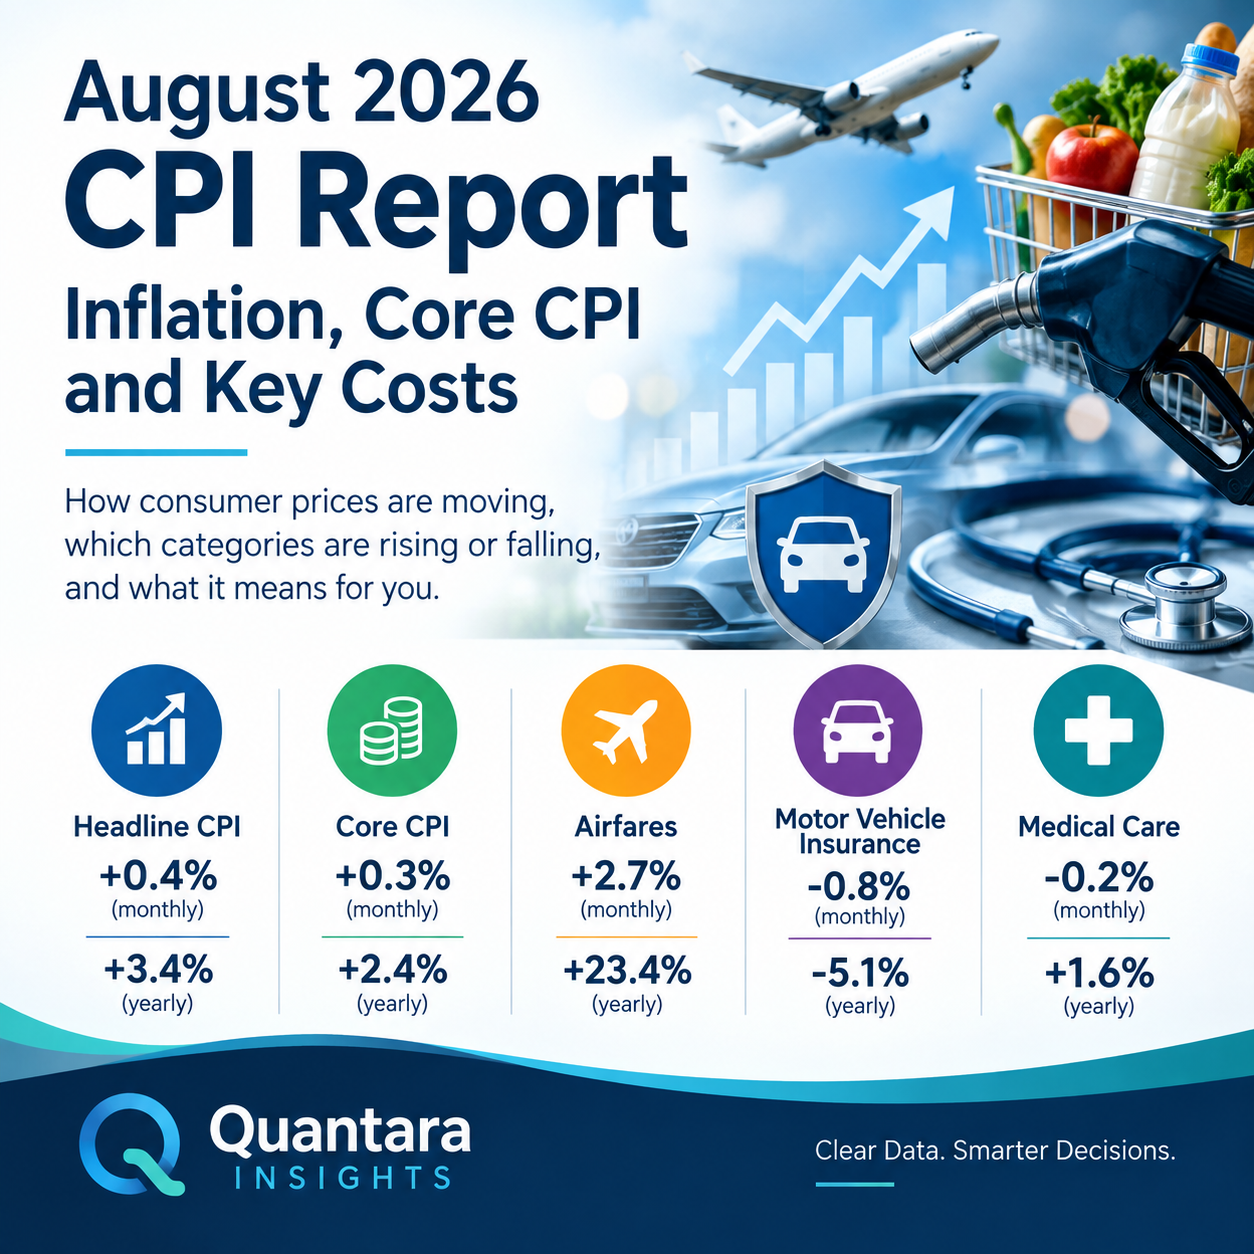
The August CPI report is particularly useful because the headline inflation number does not tell the entire story. The overall CPI increased 0.4% on a seasonally adjusted basis in August, following a 0.1% increase in July. Over the 12 months ending in August, the all-items index increased 3.4%, the same annual rate recorded in July.
Core CPI, which excludes food and energy, increased 0.3% in August after rising 0.2% in July. Over the year, Core CPI increased 2.4%, compared with 2.5% for the 12 months ending in July. That difference matters because it shows that the broader underlying price measure was somewhat softer on an annual basis even as the headline CPI accelerated during August.
The individual categories also tell an important story. Gasoline prices increased 3.9% in August and accounted for more than one-third of the monthly increase in the all-items index. The overall energy index increased 2.1%. Shelter rose 0.3%, while food increased 0.1%.
At the same time, some consumer costs moved in the opposite direction. Motor vehicle insurance declined 0.8% in August after falling 0.3% in July. The medical care index declined 0.2%, while dental services fell 0.6%. Airfares, by contrast, increased 2.7% during August and were up 23.4% over the previous 12 months.
The earnings data add another dimension to the CPI picture. Average hourly earnings increased 0.3% in August, but consumer prices increased 0.4%. As a result, real average hourly earnings decreased 0.1% over the month. Real average weekly earnings nevertheless increased 0.2%, helped by a 0.3% increase in the average workweek.
Taken together, the August data point to an inflation environment in which the overall pace of price increases remains elevated relative to the Federal Reserve’s 2% objective, but individual consumer categories continue to behave very differently.
What the August 2026 CPI Report Shows
The Consumer Price Index measures changes in the prices consumers pay for a broad range of goods and services. Because household spending is spread across many categories, the CPI is not a measure of a single price or a single type of inflation.
In August 2026, the headline CPI increased 0.4% on a seasonally adjusted basis. That was four times July’s 0.1% increase.
The annual CPI rate, however, remained at 3.4%. In other words, the monthly acceleration did not result in a higher 12-month inflation rate because the annual comparison incorporates price changes over the preceding year.
Several major components contributed to the August increase.
Energy was one of the most significant contributors. The energy index increased 2.1%, while gasoline increased 3.9%. Gasoline alone accounted for more than one-third of the monthly increase in the all-items CPI.
Shelter also continued to rise. The shelter index increased 0.3% in August, following a 0.1% increase in July.
Food prices increased 0.1%. Food at home was unchanged, while food away from home increased 0.3%.
Core CPI increased 0.3%. Within the core categories, airfares increased 2.7%, lodging away from home increased 2.4%, communication increased 2.3%, and education increased 0.8%.
Other categories moved lower. Medical care declined 0.2%, and motor vehicle insurance fell 0.8%.
This combination illustrates why examining the components of CPI is important. A headline increase can coexist with declines in specific household expenses.
CPI Increased 3.4% Over the Past Year
The annual CPI rate was 3.4% in August 2026, unchanged from July.
That means the overall level of consumer prices was 3.4% higher than it was 12 months earlier. It does not mean that every household experienced a 3.4% increase in its cost of living.
Household spending patterns differ considerably. A household that spends more on gasoline, air travel or shelter may experience a different effective increase in expenses from a household that spends relatively little on those categories.
The August data show particularly large differences between individual components.
Energy increased 16.3% over the 12 months ending in August. Gasoline increased 27.4% over the same period.

Shelter increased 3.0% over the year.
Food increased 2.7%.
Core CPI increased 2.4%.
Airfares increased 23.4%.
Medical care increased 1.6%.
These differences are significant because the headline CPI is a weighted average. The relative importance of each category affects how much that category contributes to the overall index.
The August CPI therefore should not be interpreted simply as evidence that all consumer prices are rising at the same pace. The data show a much more differentiated inflation environment.
Core CPI Provides a Different View of Inflation
Core CPI is commonly used as a way to examine price changes excluding food and energy.
In August, Core CPI increased 0.3% after increasing 0.2% in July.
Over the 12 months ending in August, Core CPI increased 2.4%, down from the 2.5% annual increase recorded in July.
That annual moderation is an important part of the August inflation picture.
Core CPI does not represent all prices consumers pay. Instead, it removes food and energy from the calculation because those categories can experience substantial short-term volatility.
That makes Core CPI useful for examining broader price movements, but it should not be viewed as a replacement for headline CPI.
Both measures provide useful information.
The headline CPI captures the actual broad movement in consumer prices, including food and energy. Core CPI provides another perspective on price changes after excluding those two categories.
The August data show that these two measures were moving at different monthly and annual rates.
Headline CPI rose 0.4% in August and 3.4% over the year.
Core CPI rose 0.3% in August and 2.4% over the year.
The difference highlights the influence of energy prices on the August results.
Energy Prices Were a Major Driver of August CPI
Energy was one of the clearest contributors to the August increase.
The energy index increased 2.1% during the month after declining 1.5% in July.
Gasoline was the largest component behind that movement. Gasoline prices increased 3.9% in August.
According to the CPI release, the gasoline increase accounted for more than one-third of the monthly increase in the all-items index.
The annual numbers are even more substantial.
Energy prices increased 16.3% over the 12 months ending in August.
Gasoline increased 27.4%.
Natural gas increased 4.4%.
Electricity increased 3.8%.
These figures demonstrate how energy can have an outsized effect on headline inflation.
When gasoline prices increase, consumers can face higher costs directly at the pump. Energy prices can also affect transportation and operating costs for businesses, although the CPI itself measures prices paid by consumers.
The August CPI therefore needs to be considered in the context of a significant energy contribution.
The contrast with July is also important. Energy declined 1.5% in July before increasing 2.1% in August.
That month-to-month change helped explain why headline CPI moved from a 0.1% increase in July to a 0.4% increase in August.
Shelter Continued to Increase
Shelter remained another important component of the CPI in August.
The shelter index increased 0.3% during the month after rising 0.1% in July.
Within shelter, owners’ equivalent rent increased 0.2%, while rent also increased 0.2%.
Over the 12 months ending in August, shelter increased 3.0%.
Shelter is an important component of household spending and therefore has substantial importance within the CPI.
The August results show that shelter inflation continued to move higher, although the annual increase was considerably different from the much larger increases seen in some categories such as gasoline and airfares.
Lodging away from home was also notable. The index increased 2.4% in August after falling 2.8% in July.
This illustrates another feature of monthly CPI data: some categories can reverse direction quickly.
A decline in one month can be followed by a sharp increase the next month without necessarily indicating a persistent trend.
For that reason, it is useful to look at monthly results alongside 12-month changes.
Airfares Increased 2.7% in August
Airfares were one of the most notable core CPI categories in August.
The airline fares index increased 2.7% during the month.
Over the 12 months ending in August, airline fares increased 23.4%.
That annual increase stands out relative to the 3.4% increase in headline CPI and the 2.4% increase in Core CPI.
The monthly increase also followed a broader pattern of volatility in travel-related prices.
Lodging away from home increased 2.4% in August after falling 2.8% in July.
Air travel and lodging are categories that can be affected by seasonal patterns, travel demand and changes in pricing conditions. A single month’s movement should therefore be interpreted carefully.
Nevertheless, the 23.4% annual increase in airline fares makes airfares one of the most significant individual price increases identified in the August report.
For consumers who travel frequently, that category can have a much greater practical effect than the headline CPI might suggest.
For consumers who rarely fly, the effect can be much smaller.
This is one reason why personal inflation experiences can differ substantially from the published CPI.
Motor Vehicle Insurance Prices Fell Again
Motor vehicle insurance was one of the categories moving in the opposite direction from the overall CPI.
The motor vehicle insurance index declined 0.8% in August after falling 0.3% in July.
That means the category recorded declines in two consecutive months.
Over the broader period, however, motor vehicle-related expenses remain mixed.
Motor vehicle insurance was down 5.1% over the 12 months ending in August.
Other vehicle-related categories moved differently.
New vehicles increased 0.3% in August and were up 0.6% over the year.
Used cars and trucks increased 0.4% in August but were down 2.3% over the year.
Motor vehicle maintenance and repair increased 1.1% in August and was up 5.2% over the year.
These figures show why transportation costs should not be treated as a single price category.
Insurance, new vehicles, used vehicles, maintenance and repair can all move differently.
For consumers, the practical effect depends on which of these expenses represents the largest share of their household budget.
The decline in motor vehicle insurance was nevertheless notable because it provided some offset to other increases within transportation-related spending.
Medical Care Prices Declined in August
Medical care was another category that moved lower in August.
The medical care index declined 0.2% during the month after increasing 0.4% in July.
Dental services declined 0.6%.
Hospital services, physicians’ services and prescription drugs were all unchanged during August.
Over the 12 months ending in August, medical care increased 1.6%.
That annual increase was below the 3.4% increase in headline CPI.
The medical care category therefore provides another example of how individual consumer prices can diverge from the overall inflation rate.
Within medical care, different services can have different pricing patterns.
The August report shows that dental services declined during the month while hospital services, physicians’ services and prescription drugs were unchanged.
The overall medical care index consequently declined 0.2%.
For households, however, medical spending can be highly individual. A person receiving a major medical service can experience a very different change in actual spending from someone who has no major medical expenses during the month.
The CPI provides an economy-wide measure rather than a personal medical-cost index.
Food Prices Increased Only Slightly
Food prices increased 0.1% in August, matching the increase recorded in July.
Food at home was unchanged during the month.
Four of the six major grocery-store food group indexes increased.
Meats, poultry, fish and eggs increased 0.1%, with eggs increasing 2.9%.
Other food at home increased 0.1%.
Nonalcoholic beverages increased 0.2%.
Dairy and related products increased 0.3%.
At the same time, fruits and vegetables declined 0.4%.
The annual food picture was somewhat stronger than the monthly result.
Food increased 2.7% over the 12 months ending in August.
Food at home increased 2.2%.
Food away from home increased 3.4%.
Within food away from home, full-service meals increased 3.5% over the year, while limited-service meals increased 3.2%.
The difference between food at home and food away from home is worth noting.
Consumers purchasing groceries experienced a lower annual increase than consumers purchasing prepared meals outside the home, based on the respective CPI categories.
Again, the overall CPI is a broad measure. Individual households can experience different price changes depending on their purchasing habits.
Communication and Education Also Increased
Several other Core CPI categories recorded increases in August.
Communication increased 2.3%.
Education increased 0.8%.
Personal care and household furnishings and operations also increased.
These categories contributed to the broader 0.3% monthly increase in Core CPI.
The diversity of these movements is important.
Core CPI does not move because of one single category. It reflects price changes across a broad range of goods and services after food and energy are excluded.
In August, some core categories increased relatively sharply while others declined.
That produced a 0.3% monthly increase and a 2.4% annual increase in Core CPI.
What the August CPI Means for Consumers
The August CPI data provide a broad picture of changing consumer prices, but they do not produce a single answer for every household.
Consumers experience inflation through their individual spending patterns.
Someone who spends heavily on gasoline may have noticed considerably higher costs because gasoline increased 3.9% in August and 27.4% over the year.
Someone who travels frequently may have faced much higher airfares, with airline fares up 23.4% over 12 months.
A household with a large vehicle-insurance bill, by contrast, may have benefited from the 0.8% monthly decline in motor vehicle insurance.
Someone with significant medical expenses may also have experienced a different pattern from the overall CPI, given the 0.2% monthly decline in the medical care index.
This variation is not a contradiction.
The CPI is designed to measure the average change in prices paid by consumers across a broad basket. It is not designed to reproduce the exact spending experience of every individual household.
That distinction is especially important when interpreting inflation headlines.
CPI and Real Earnings Tell Different Parts of the Story
Inflation data become more meaningful when considered alongside earnings.
The August Real Earnings report shows that average hourly earnings for all employees increased 0.3% from July to August.
At the same time, CPI-U increased 0.4%.
Because consumer prices increased faster than average hourly earnings during the month, real average hourly earnings decreased 0.1%.
That means purchasing power measured on an hourly basis declined slightly during August.
However, real average weekly earnings increased 0.2%.
The difference was partly explained by an increase in the average workweek.
Average weekly hours increased 0.3% in August.
Average hourly earnings reached $37.75, up 0.3% from July and 3.1% from August 2025.
Average weekly earnings increased 0.6% over the month to $1,298.60.
Over the year, nominal average weekly earnings increased 3.7%.
Real average weekly earnings increased 0.3% over the same 12-month period.
This combination shows why hourly and weekly earnings should not be treated as interchangeable.
An employee’s real hourly purchasing power can decline even while real weekly earnings increase if the employee works more hours.
Real Hourly Earnings Declined 0.1% in August
The monthly decline in real average hourly earnings was relatively modest at 0.1%.
Nevertheless, it is an important measure because real earnings account for the effect of consumer prices.
Nominal earnings tell us how much pay increased in dollar terms.
Real earnings provide an indication of how that pay change compares with changes in consumer prices.
In August, average hourly earnings increased 0.3%, while CPI-U increased 0.4%.
The resulting real average hourly earnings change was -0.1%.
Over the 12 months from August 2025 to August 2026, real average hourly earnings decreased 0.3%.
This means that the annual increase in nominal hourly earnings did not fully offset the increase in consumer prices over that period.
Average hourly earnings increased 3.1% over the year, while the CPI-U increased 3.4%.
That comparison helps explain the -0.3% change in real average hourly earnings.
Real Weekly Earnings Increased
The picture changes when weekly earnings are considered.
Real average weekly earnings increased 0.2% from July to August.
Over the 12 months ending in August, real average weekly earnings increased 0.3%.
The August increase occurred even though real hourly earnings declined.
The reason was the increase in the average workweek.
Average weekly hours increased from 34.3 to 34.4 hours.
Average weekly earnings increased 0.6% in nominal terms during August, reaching $1,298.60.
This demonstrates why consumers and analysts should consider both pay rates and hours worked when evaluating purchasing power.
A higher hourly wage does not necessarily translate directly into higher weekly income if hours decline.
Likewise, a modest decline in real hourly earnings does not necessarily result in lower real weekly earnings if the workweek increases.
Production and Nonsupervisory Workers Saw Similar Pressure
The Real Earnings report also provides data for production and nonsupervisory employees.
For this group, real average hourly earnings declined 0.1% from July to August.
Average hourly earnings increased 0.3%, while the CPI-W increased 0.5%.
Real average weekly earnings declined 0.1% over the month.
Over the year from August 2025 to August 2026, real average hourly earnings for production and nonsupervisory employees declined 0.1%.
Real average weekly earnings increased 0.1%.
Average hourly earnings for this group increased 3.3% over the year.
Average weekly hours increased 0.3% over the year, while average weekly earnings increased 3.6%.
The data again show that inflation-adjusted purchasing power can differ depending on whether the measurement is hourly or weekly.
Why the Monthly CPI Increase Matters
The increase from 0.1% in July to 0.4% in August is one of the most visible changes in the latest CPI report.
But interpreting that increase requires context.
More than one-third of the monthly all-items increase came from gasoline.
Energy increased 2.1%.
Shelter increased 0.3%.
Food increased 0.1%.
Core CPI increased 0.3%.
That means the monthly acceleration in headline CPI was not evenly distributed across all categories.
Energy played a significant role.
The annual headline CPI rate remained at 3.4%, unchanged from July.
Core CPI’s annual rate actually decreased from 2.5% to 2.4%.
Therefore, the August report contains both an acceleration in the monthly headline measure and some moderation in the annual core measure.
Those two observations can exist simultaneously because monthly and annual CPI measures answer different questions.
The monthly measure describes the latest change.
The annual measure compares prices with the same period a year earlier.
August CPI Compared With July
The shift from July to August can be summarized as follows:
| Category | July 2026 | August 2026 |
|---|---|---|
| Headline CPI, monthly | +0.1% | +0.4% |
| Core CPI, monthly | +0.2% | +0.3% |
| Energy, monthly | -1.5% | +2.1% |
| Gasoline, monthly | — | +3.9% |
| Shelter, monthly | +0.1% | +0.3% |
| Food, monthly | +0.1% | +0.1% |
| Medical care, monthly | +0.4% | -0.2% |
| Motor vehicle insurance, monthly | -0.3% | -0.8% |
| Airfares, monthly | — | +2.7% |
The table illustrates the divergence within the CPI.
The headline index accelerated.
Core CPI also accelerated slightly on a monthly basis.
Energy shifted sharply from a decline to an increase.
Shelter increased more quickly.
Medical care shifted from an increase to a decline.
Motor vehicle insurance declined more sharply.
Airfares increased significantly.
This is why a detailed reading of the CPI report is more informative than focusing exclusively on the headline number.
The Annual CPI Picture Is Also Highly Uneven
The 12-month data provide another useful comparison.
| Category | 12-month change through August 2026 |
|---|---|
| Headline CPI | +3.4% |
| Core CPI | +2.4% |
| Energy | +16.3% |
| Gasoline | +27.4% |
| Shelter | +3.0% |
| Food | +2.7% |
| Food at home | +2.2% |
| Food away from home | +3.4% |
| Airfares | +23.4% |
| Medical care | +1.6% |
| Motor vehicle insurance | -5.1% |
| New vehicles | +0.6% |
| Used cars and trucks | -2.3% |
The contrast is substantial.
Energy and gasoline were rising much faster than the overall CPI.
Airfares were also increasing much faster.
Medical care was increasing more slowly than headline CPI.
Motor vehicle insurance and used vehicles were declining over the year.
These differences reinforce the point that inflation is not uniform.
What Businesses Should Watch in the CPI Data
Businesses can use CPI information to monitor changing consumer costs and potential changes in demand.
The August report suggests that companies exposed to energy-sensitive consumers may need to pay attention to gasoline and energy prices.

Businesses in travel-related industries also face a notable price environment. Airfares increased 2.7% in August and 23.4% over the year.
At the same time, businesses connected to motor vehicle insurance are operating in a category that declined 5.1% over the year.
Medical care showed a more moderate annual increase of 1.6%.
The broader business implication is not that every company faces the same inflation rate.
Instead, companies should identify the CPI categories most closely connected to their customers, employees and operating expenses.
A retailer focused on groceries will have a different exposure from an airline, insurer, healthcare provider, automobile business or travel company.
CPI data become more useful when connected to the specific spending and pricing patterns relevant to an organization.
What Consumers Should Watch Next
The August CPI report provides several areas to monitor in future releases.
Energy is one of the clearest.
Gasoline increased 3.9% in August and 27.4% over the year. Because energy prices can change quickly, future movements could materially affect the headline CPI.
Shelter is another important category.
Shelter increased 0.3% in August and 3.0% over the year.
Core CPI should also remain important because it increased 0.3% in August and 2.4% over the year.
Travel prices deserve attention as well.
Airfares increased 2.7% during August and 23.4% over the year.
Motor vehicle insurance is another category to monitor because it declined 0.8% in August and 5.1% over the year.
Medical care also deserves attention, particularly because the overall category declined 0.2% in August while individual components such as dental services moved lower and other major components were unchanged.
The next CPI report will help determine whether these August movements represent short-term changes or the continuation of broader trends.
How to Read the CPI Without Overreacting to One Month
One of the most important principles when analyzing CPI data is to avoid drawing broad conclusions from a single monthly movement.
The August increase of 0.4% is meaningful, but it should be considered alongside the 3.4% annual increase and the 2.4% annual Core CPI increase.
It is also important to identify what drove the monthly movement.
In August, gasoline and energy were major contributors.
Other categories moved in different directions.
A single month’s increase does not automatically mean that every category is accelerating.
Likewise, a decline in a single category does not necessarily indicate a lasting reversal.
The most useful analysis combines:
- The monthly CPI change
- The 12-month CPI change
- Core CPI
- Major individual categories
- Energy and food
- Shelter
- Transportation
- Medical care
- Real earnings
- Changes across multiple months
This approach provides a more balanced understanding of consumer prices.
CPI, Core CPI and the Broader Inflation Trend
The August data show three distinct but connected measures.
Headline CPI increased 0.4% during August and 3.4% over the year.
Core CPI increased 0.3% during August and 2.4% over the year.
Real average hourly earnings decreased 0.1% during August and 0.3% over the year.
Together, these numbers describe an environment in which prices continue to rise faster than the Federal Reserve’s longer-run inflation objective, while underlying inflation excluding food and energy is lower than headline inflation.
The difference between headline and core inflation was particularly visible in August because energy prices increased sharply.
At the same time, some consumer categories were declining.
Motor vehicle insurance fell.
Medical care fell.
Used vehicles were down over the year.
This is not an environment in which every price is moving in the same direction.
Instead, the latest CPI data show a broad inflation rate accompanied by significant differences between individual categories.
Frequently Asked Questions About the August 2026 CPI
What was the CPI increase in August 2026?
The CPI increased 0.4% on a seasonally adjusted basis in August 2026. Over the 12 months ending in August, the all-items CPI increased 3.4%.
What was Core CPI in August 2026?
Core CPI, measured as all items less food and energy, increased 0.3% in August. Over the 12 months ending in August, Core CPI increased 2.4%.
What happened to motor vehicle insurance in August 2026?
Motor vehicle insurance declined 0.8% in August after falling 0.3% in July. Over the year, the index declined 5.1%.
How much did airfares increase in August 2026?
Airfares increased 2.7% in August. Over the 12 months ending in August, airline fares increased 23.4%.
Did medical care prices increase in August 2026?

No. The medical care index declined 0.2% in August. Dental services declined 0.6%, while hospital services, physicians’ services and prescription drugs were unchanged.
How much did gasoline prices increase in August 2026?
The gasoline index increased 3.9% in August. Over the 12 months ending in August, gasoline prices increased 27.4%.
Did shelter prices increase in August 2026?
Yes. The shelter index increased 0.3% in August. Over the year, shelter increased 3.0%.
Did real wages increase in August 2026?
Real average hourly earnings decreased 0.1% in August. Real average weekly earnings increased 0.2%, partly because the average workweek increased 0.3%.
What was the average hourly wage in August 2026?
Average hourly earnings for all employees were $37.75 in August, an increase of 0.3% from July and 3.1% from August 2025.
What does the August CPI report mean for consumers?
The report shows that consumer prices continued to increase overall, but the changes varied considerably by category. Energy and airfares rose sharply, while motor vehicle insurance and medical care declined in August.
Key Takeaways From the August 2026 CPI Report
The August CPI report presents a mixed picture rather than a uniform increase across consumer prices.
The headline CPI increased 0.4% in August, compared with 0.1% in July.
The annual CPI rate remained at 3.4%.
Core CPI increased 0.3% in August, while its annual rate declined to 2.4%.
Energy was a major contributor to the monthly increase. The energy index increased 2.1%, while gasoline increased 3.9%.
Gasoline prices were up 27.4% over the year.
Shelter increased 0.3% during August and 3.0% over the year.
Airfares increased 2.7% during August and 23.4% over the year.
Motor vehicle insurance declined 0.8% in August and 5.1% over the year.
Medical care declined 0.2% in August and increased 1.6% over the year.
Food increased 0.1% in August and 2.7% over the year.
Real average hourly earnings declined 0.1% in August, while real average weekly earnings increased 0.2%.
The overall message is that inflation remains positive, but its effects are uneven across consumer categories.
For households, businesses and analysts, the most useful approach is to look beyond the headline CPI and examine the specific categories that matter most.
Conclusion: What the August 2026 CPI Data Tell Us
The August 2026 CPI report shows that consumer prices continued to rise, with the headline CPI increasing 0.4% during the month and 3.4% over the past year.
The monthly increase was stronger than July’s 0.1% gain, but the annual inflation rate was unchanged.
Core CPI increased 0.3% during August and 2.4% over the year, providing a somewhat lower annual measure of inflation than the headline index.
Energy was a major factor behind the August increase, particularly gasoline. Gasoline prices rose 3.9% during the month and 27.4% over the year.
Other categories produced a very different picture.
Airfares increased sharply, while motor vehicle insurance declined. Medical care also declined during the month. Food increased only slightly, while shelter continued to rise.
The earnings data provide an additional perspective. Nominal hourly earnings increased 0.3%, but consumer prices increased 0.4%, resulting in a 0.1% decline in real average hourly earnings. Real weekly earnings increased 0.2%, reflecting an increase in average weekly hours.
The most important takeaway is that the August CPI should be understood as a collection of different price trends rather than as one uniform inflation number.
For consumers, the effect depends on spending patterns.
For businesses, the implications depend on exposure to specific categories.
For analysts, the distinction between headline CPI, Core CPI, individual categories and real earnings provides a more complete picture of the current inflation environment.
The August data therefore offer a detailed view of where consumer prices are rising, where they are falling and how those changes compare with changes in employee earnings.