




The CPI increased 0.1% on a seasonally adjusted basis in July 2026 after declining 0.4% in June, according to the U.S. Bureau of Labor Statistics. Over the 12 months through July, the all-items CPI increased 3.4% before seasonal adjustment. The latest report presents a mixed picture: overall inflation moderated slightly from June, core inflation also eased, food prices continued to rise, and energy remained a significant contributor to the annual increase.
The July CPI data also provide an important view of household purchasing power. The separate BLS real earnings report showed that real average hourly earnings for all employees decreased 0.1% from June to July on a seasonally adjusted basis. Over the year from July 2025 to July 2026, real average hourly earnings declined 0.2%.
That combination matters because nominal wage increases do not necessarily translate into greater purchasing power. If consumer prices continue to rise faster than real earnings, households can face pressure even when paychecks are increasing.
The July CPI report therefore needs to be viewed through several measures rather than one headline number. Headline inflation, core inflation, Food prices, energy prices, shelter costs and real earnings each tell a different part of the story.
What the July 2026 CPI Report Shows
The main July CPI figures are straightforward:
| Measure | July 2026 result |
|---|---|
| Monthly all-items CPI | +0.1% |
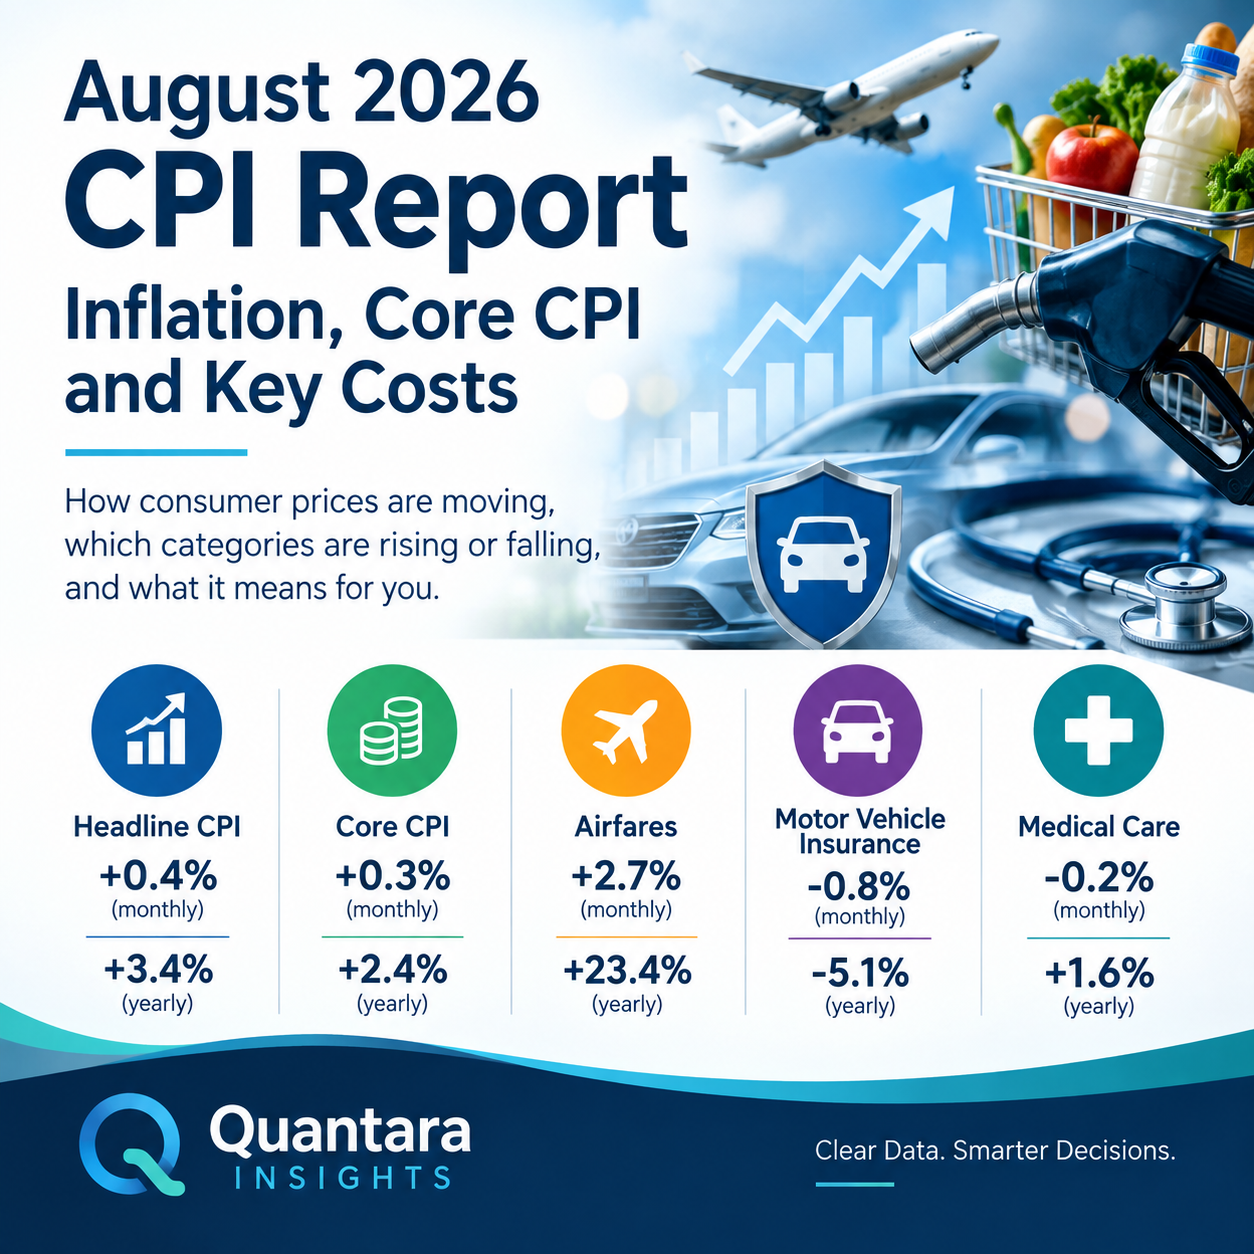
| Annual all-items CPI | +3.4% |
| Monthly CPI less food and energy | +0.2% |
| Annual core CPI | +2.5% |
| Monthly Food index | +0.1% |
| Annual Food index | +3.0% |
| Monthly energy index | -1.5% |
| Annual energy index | +14.7% |
| Monthly shelter index | +0.1% |
| Annual shelter index | +3.2% |
The headline CPI increased 3.4% over the 12 months ending in July, compared with a 3.5% increase over the 12 months ending in June.
At the monthly level, the CPI rose 0.1% after falling 0.4% in June.
The difference between those monthly and annual measures is important. A single month’s movement can be influenced by changes in individual categories, while the annual rate provides a broader picture of how the overall consumer price level has changed over the previous year.
CPI and Inflation: What Changed From June to July?
The July CPI report shows a modest change in the pace of consumer-price increases.
The all-items index increased 0.1% in July after declining 0.4% in June. On an annual basis, the increase slowed from 3.5% in June to 3.4% in July.
That does not mean prices fell overall. Rather, it means the rate of increase in the overall price index was lower over the 12-month period than it had been one month earlier.
This distinction is essential when discussing Inflation.
Inflation describes the rate at which the general price level changes. A decline in the inflation rate does not mean that the prices consumers see in stores, restaurants, housing markets or service businesses have returned to earlier levels.
The July CPI figures illustrate this difference clearly. Prices continued to rise, but the annual pace of the increase was slightly lower than in June.
For households, the practical effect depends on which goods and services they purchase. Someone spending a large share of their budget on food, housing or transportation may experience price pressure differently from someone whose spending is concentrated in categories with slower price increases.
Core Inflation Remains Below Headline CPI
One of the most closely watched figures in the July CPI report is Core Inflation, measured by the index for all items less food and energy.
The core index increased 0.2% in July after being unchanged in June. Over the 12 months ending in July, core CPI increased 2.5%, down from a 2.6% annual increase in June.
The distinction between headline CPI and Core Inflation helps analysts assess the breadth and persistence of price changes.
Food and energy can experience substantial price movements because of factors that are not necessarily representative of broader price trends. The core measure removes those two categories to provide another way of examining underlying consumer-price movements.
However, consumers still pay for food and energy, so core CPI should not be treated as a replacement for headline inflation.
The July numbers show both measures moving at different rates:
- Headline CPI increased 3.4% over the year.
- Core CPI increased 2.5%.
- Food increased 3.0%.
- Energy increased 14.7%.
This gap is one of the most important features of the latest report.
Shelter Remains an Important Part of CPI
Shelter continued to play a significant role in the July CPI increase.
The shelter index rose 0.1% in July and accounted for roughly two-thirds of the monthly increase in the all-items index, according to the BLS report.
Within shelter, owners’ equivalent rent increased 0.3%, while rent also increased 0.3%. Lodging away from home, by contrast, declined 2.8% during the month.
Over the year, shelter increased 3.2%.
Housing-related costs matter because shelter represents a significant component of household spending and has a substantial weight in the CPI calculation.
The July report therefore illustrates why the headline CPI should not be interpreted simply by looking at food and energy. Housing and services also influence the overall price index.

For households, shelter inflation can be particularly important because rent and housing-related costs can be recurring expenses rather than occasional purchases.
Food Prices Remain an Important Inflation Indicator
Food prices increased 0.1% in July after rising 0.2% in June.
The monthly change was relatively modest, but the annual increase was more significant. The Food index increased 3.0% over the 12 months ending in July.
Food at home declined 0.1% in July, while food away from home increased 0.3%.
This distinction is useful because grocery prices and restaurant prices do not necessarily move together.
Food at home declined in July
The index for food at home decreased 0.1% in July.
Three of the six major grocery-store food group indexes declined during the month.
The meats, poultry, fish and eggs index decreased 0.7%, while pork prices fell 1.5%. The fruits and vegetables index declined 0.1%, with lettuce falling 16.4%. Dairy and related products also declined 0.1%.
Other food-at-home prices were unchanged.
At the same time, nonalcoholic beverages increased 0.9%, while cereals and bakery products increased 0.2%.
The mixed movement across categories shows why the overall Food index can sometimes conceal substantial differences between individual products.
A household purchasing more meat may experience a different monthly price change from one purchasing more beverages, bakery products or vegetables.
Annual food inflation remains positive
Over the year through July, food at home increased 2.7%.
Several categories recorded larger increases:
- Fruits and vegetables: +5.1%
- Nonalcoholic beverages: +4.1%
- Other food at home: +2.5%
- Cereals and bakery products: +2.7%
- Meats, poultry, fish and eggs: +1.9%
Dairy and related products moved in the opposite direction, declining 0.5% over the year.
These figures demonstrate that Food inflation is not uniform. Individual categories can move in different directions even when the overall food index rises.
Food Away From Home Continues to Rise Faster
Food away from home increased 0.3% in July.
Limited-service meals increased 0.4%, while full-service meals increased 0.2%.
Over the year, food away from home increased 3.4%.
Full-service meals increased 3.4%, while limited-service meals increased 3.3%.
The difference between grocery and restaurant inflation is notable. Food at home increased 2.7% over the year, compared with 3.4% for food away from home.
For consumers, this means the experience of Inflation can depend partly on whether more spending occurs at supermarkets or restaurants.
The July CPI report therefore provides a useful reminder that the overall inflation rate is an average across many different categories and spending patterns.
Energy Prices Fell in July but Remain Higher Over the Year
Energy was another major component of the July CPI report.
The energy index decreased 1.5% in July after declining 5.7% in June.
Gasoline prices declined 2.9% during the month. Natural gas increased 0.7%, while electricity increased 0.1%.
Despite the monthly decline, energy prices were substantially higher over the year.
The energy index increased 14.7% over the 12 months ending in July. Gasoline increased 24.6% over the same period, natural gas increased 4.3%, and electricity increased 4.2%.
This is a major reason why headline CPI was higher than Core Inflation in the July annual comparison.
The energy data also show why month-to-month and year-over-year figures need to be considered together. A category can decline in one month while still recording a substantial annual increase.
CPI, Real Earnings and Household Purchasing Power
The July CPI report becomes more meaningful when considered alongside the BLS real earnings release.
Real average hourly earnings for all employees decreased 0.1% from June to July on a seasonally adjusted basis.
The BLS attributed the decline to a 0.1% increase in average hourly earnings combined with a 0.1% increase in the CPI-U.
Real average weekly earnings were unchanged over the month because real hourly earnings declined while the average workweek did not change.
Over the year from July 2025 to July 2026, real average hourly earnings declined 0.2%.
Nominal average hourly earnings, meanwhile, increased 3.2% over the year.
This difference is important.
Nominal pay measures how much workers earn in current dollars. Real pay adjusts earnings for changes in consumer prices. The real measure is therefore more directly related to purchasing power.
The July data show that nominal earnings were increasing while real hourly earnings were slightly lower than a year earlier.
What the CPI Data Say About Wage Growth
Wage Growth and price growth need to be considered together.
The BLS reported that average hourly earnings increased 0.1% from June to July and 3.2% from July 2025 to July 2026.
Over the same year, the CPI-U increased 3.3% in the real earnings table.
As a result, real average hourly earnings decreased 0.2% over the year.
This relationship matters for consumers because wage Growth does not automatically translate into stronger purchasing power.
If wages increase by 3.2% while consumer prices increase by more than 3%, the inflation-adjusted improvement in hourly purchasing power can be limited or negative.
The July CPI and real earnings reports therefore tell a connected story: nominal wages continued to increase, but price growth remained strong enough to put modest pressure on real hourly earnings.
Real Weekly Earnings Provide a Slightly Different Picture
The BLS data also show why hourly and weekly earnings should not be treated as identical measures.
Real average weekly earnings were unchanged from June to July.
From July 2025 to July 2026, real average weekly earnings increased 0.1%.
The difference from hourly earnings partly reflects the average workweek.
For all employees, the average workweek increased 0.3% over the year. That helped offset the 0.2% decline in real average hourly earnings and resulted in a 0.1% increase in real average weekly earnings.
This is a useful distinction when considering household income and Growth.
A worker’s purchasing power depends not only on the real value of each hour worked but also on the number of hours worked and total earnings.
The July reports therefore suggest a more nuanced picture than either a simple “wages are rising” or “purchasing power is falling” statement.
Production and Nonsupervisory Workers
The real earnings report also provides data for production and nonsupervisory employees.
Real average hourly earnings for this group were unchanged from June to July.
That result reflected a 0.1% increase in average hourly earnings combined with a 0.1% increase in the CPI-W.
Real average weekly earnings increased 0.1% over the month.
Over the year, real average hourly earnings declined 0.1%, while real average weekly earnings increased 0.2%.
Nominal average hourly earnings increased 3.2% over the year for this group.
The figures reinforce the importance of looking at both nominal and real measures when assessing earnings Growth.
What Does the July CPI Mean for Economic Growth?
The July CPI report does not by itself measure economic Growth.
The CPI measures changes in consumer prices, while economic growth is assessed through broader measures of economic activity, such as output and production.
However, inflation and Growth are closely related because persistent price increases can affect household purchasing decisions, business costs, interest-rate expectations and real incomes.
The July data show that headline CPI inflation remained above core inflation, largely reflecting the substantial annual increase in energy prices.
At the same time, real hourly earnings were slightly lower than a year earlier.
These conditions can influence consumer behavior. When households face higher prices without equivalent increases in real purchasing power, they may adjust spending patterns.
For businesses, changes in input and labor costs can also influence pricing decisions.
It is therefore reasonable to use the July CPI report as one input into the broader economic outlook, but the data should not be interpreted as a standalone measure of economic Growth.
Which CPI Categories Increased Most?
The July report shows considerable variation among categories.
Some of the more notable annual increases included:
| Category | Annual change through July 2026 |
| All-items CPI | +3.4% |
| Core CPI | +2.5% |
| Food | +3.0% |
| Food at home | +2.7% |
| Food away from home | +3.4% |
| Energy | +14.7% |
| Gasoline | +24.6% |
| Shelter | +3.2% |
| Airline fares | +25.5% |
| Medical care | +1.7% |
| Recreation | +2.6% |
| Household furnishings and operations | +2.2% |
These figures demonstrate that the headline CPI is being shaped by a wide range of price movements.
Energy and gasoline recorded particularly large annual increases, while some categories experienced smaller increases or declines.
Airline fares also increased 25.5% over the year, although transportation prices do not necessarily move consistently from one month to another.
Medical Care and Other Services
The services component of the CPI also showed several changes in July.
The medical care index increased 0.4% during the month.
Hospital services increased 0.5%, while physicians’ services increased 0.2%. Prescription drug prices declined 0.8%.
Over the year, medical care increased 1.7%.
Other service categories also increased during July. Communication rose 0.6%, education increased 0.5%, and recreation increased 0.2%.
These categories are relevant when considering Core Inflation, because the core measure includes services and other consumer prices outside food and energy.
The July core CPI increase of 0.2% indicates that underlying price pressures were still present even as some categories recorded declines.
Transportation Prices Were Mixed
Transportation-related prices moved in different directions.
Airline fares increased 2.2% in July after rising 0.2% in June. Used cars and trucks increased 0.4%.
Motor vehicle insurance, however, declined 0.3% in July after falling 2.0% in June.
New vehicles also increased during the month.
The annual picture was similarly mixed. Airline fares increased 25.5% over the year, making them one of the largest annual increases reported in the release.
These differences demonstrate why consumers can experience the CPI differently depending on their spending patterns.
A household that travels frequently by air may encounter a different price environment from a household whose largest transportation expenses involve vehicle ownership.
Why Core Inflation Matters
Core Inflation remains an important measure because it removes food and energy from the index.
In July, core CPI increased 0.2% after remaining unchanged in June.
Over the year, core CPI increased 2.5%.
That annual rate was below the 3.4% headline CPI increase.
The difference suggests that energy and food-related price movements were contributing meaningfully to the gap between headline and core inflation.
However, core CPI should not be interpreted as a measure that excludes all meaningful consumer costs. Housing, medical care, transportation, education, recreation and many other services remain included.
For this reason, Core Inflation can be useful for assessing broader price movements while headline CPI remains essential for understanding the actual overall price environment faced by consumers.
CPI-U, CPI-W and Real Earnings
The BLS publishes multiple versions of the CPI for different population groups.
The CPI-U covers all urban consumers and represents more than 90% of the U.S. population.
The CPI-W is based on urban wage earners and clerical workers who meet specific employment and income criteria.
The July CPI-U increased 3.4% over the year.
The CPI-W also increased 3.4% over the year.
The real earnings report uses the CPI-U to deflate earnings for all employees and the CPI-W to deflate earnings for production and nonsupervisory employees.
This approach allows nominal earnings to be converted into constant-dollar measures.
Understanding which CPI series is being used is important when interpreting real wage data.
What the July CPI Says About Consumers
For consumers, the July CPI report points to continued but uneven price increases.
The overall price index rose 3.4% over the year.
Food prices rose 3.0%, with food at home increasing 2.7% and food away from home increasing 3.4%.
Shelter increased 3.2%.
Energy prices increased much faster, at 14.7%, while gasoline increased 24.6%.
At the same time, real average hourly earnings declined 0.2% over the year.
This combination suggests that household purchasing power remains an important consideration.

A consumer does not experience the official CPI as a single number. Actual household inflation depends on spending patterns.
For example, a household with high grocery and gasoline expenses may feel more price pressure than the headline figure suggests, while a household with fewer energy purchases may experience a different effective rate.
Is Inflation Falling or Rising in July 2026?
The answer depends on which comparison is being used.
On a monthly basis, the all-items CPI increased 0.1% in July after falling 0.4% in June.
On an annual basis, headline inflation slowed from 3.5% in June to 3.4% in July.
Core CPI increased 0.2% in July and rose 2.5% over the year.
So the July data indicate that annual headline Inflation moderated slightly, while monthly core price growth resumed after being unchanged in June.
At the same time, energy prices continued to record a substantial annual increase.
The appropriate conclusion is therefore that inflation remains positive but uneven, rather than simply describing the July report as either a broad acceleration or a broad decline.
What Should Be Watched in Future CPI Reports?
Several categories will remain important in upcoming CPI reports.
1. Core inflation
The direction of Core Inflation will help show whether price increases outside food and energy are continuing at a steady pace.
2. Energy
Energy prices recorded a 14.7% annual increase in July. Future movements could have a significant effect on headline CPI comparisons.
3. Food
Food prices increased 3.0% over the year, but individual categories moved differently. Grocery and restaurant inflation should continue to be monitored separately.
4. Shelter
Shelter increased 3.2% over the year and accounted for roughly two-thirds of the monthly headline increase in July.
5. Real earnings
Real hourly earnings declined 0.2% over the year. Future reports will help show whether wage Growth begins to outpace consumer-price increases more consistently.
6. Services
Medical care, communication, education, recreation and transportation services all contributed to monthly price changes in July.
CPI and the Difference Between Price Levels and Inflation Rates
One of the most common misunderstandings about the CPI involves the difference between a price level and the inflation rate.
If inflation slows from 4% to 3%, prices are still increasing. They are simply increasing at a slower rate.
The July CPI rose 3.4% over the year. That means the overall index was higher than it was a year earlier.
It does not mean that every product increased exactly 3.4%.
Some categories increased much more, while others increased less or declined.
For example, gasoline increased 24.6% over the year, while dairy and related products declined 0.5%.
This variation is why the CPI is best understood as a broad statistical measure rather than a direct measure of any individual household’s personal inflation rate.
Why the CPI Is Important for Businesses
Businesses also pay close attention to CPI data.
Consumer prices can affect purchasing decisions, wage negotiations, service pricing and operating costs.
A business facing higher prices for labor, transportation or supplies may need to evaluate whether those costs can be absorbed or passed through to customers.
At the same time, consumers may become more price-sensitive when inflation remains elevated.
The July CPI data show that the price environment remains mixed rather than uniform.
Businesses operating in food service, transportation, housing-related activities or energy-sensitive industries may experience different conditions from businesses whose costs are more closely linked to categories with slower inflation.
CPI Does Not Measure the Cost of Living Perfectly
The CPI is an important economic indicator, but it should not be interpreted as a perfect representation of every household’s cost of living.
The index is constructed from a broad basket of consumer goods and services and uses expenditure weights to represent the spending patterns of the relevant population.
The BLS collects prices from a wide range of urban locations and establishments.
Because households have different spending patterns, their personal inflation experiences can differ from the overall CPI.
A household spending heavily on gasoline, rent and restaurant meals may face different effective price changes from a household spending more on categories where prices are increasing more slowly.
This distinction is particularly important when discussing Food and energy, because those categories can represent a substantial share of some household budgets.
The July CPI Report in Perspective
The July 2026 CPI report presents a measured but uneven inflation picture.
Headline CPI increased 0.1% during July and 3.4% over the year.
Core CPI increased 0.2% during the month and 2.5% over the year.
Food increased 0.1% in July and 3.0% over the year.
Energy declined 1.5% during the month but remained 14.7% higher than a year earlier.
Shelter increased 0.1% during July and 3.2% over the year.
At the same time, real average hourly earnings declined 0.2% over the year, while real average weekly earnings increased 0.1%.
Taken together, the data suggest that inflation remains an important consideration for households even as some measures show modest improvement.
The key issue is not simply whether the CPI is rising or falling in a single month. It is how the different components of inflation evolve and how those changes interact with wages, employment, spending and broader economic Growth.
What the July CPI Report Means for Inflation
The July CPI data show a modest easing in annual headline inflation, from 3.5% in June to 3.4% in July.
That is a relatively small change, but it is directionally important when viewed alongside the decline in annual core inflation from 2.6% to 2.5%.
At the same time, the annual increase in energy prices remained substantial.
The report therefore does not point to a single uniform trend across the economy.
Instead, it shows different categories moving at different speeds.
That is particularly clear when comparing Food, energy and core prices.
Food inflation was 3.0%, core inflation was 2.5%, and energy inflation was 14.7%.
For analysts and consumers, monitoring those individual components can provide more information than relying exclusively on the headline CPI.
Final Takeaway: CPI, Inflation, Food and Real Purchasing Power
The July 2026 CPI report provides a detailed picture of an economy where consumer prices continue to rise, but not uniformly.
Headline CPI increased 3.4% over the year, down slightly from June’s 3.5% rate. Core CPI increased 2.5%, also slightly lower than the previous month’s annual rate.
Food prices increased 3.0% over the year. Food at home increased 2.7%, while food away from home increased 3.4%.
Energy was the clearest source of elevated annual price growth, increasing 14.7%, with gasoline up 24.6%.
Shelter increased 3.2% and accounted for roughly two-thirds of the monthly headline CPI increase.
The real earnings figures add another important dimension. Real average hourly earnings declined 0.2% over the year, while real average weekly earnings increased 0.1%.
For households, the message is that nominal wage Growth and real purchasing power are not the same thing. For businesses and policymakers, the different movements in headline inflation, Core Inflation, Food, energy and shelter provide important context for evaluating the broader economic environment.
The July CPI report is therefore best understood as a collection of signals rather than a single number. Inflation moderated slightly on an annual basis, but price pressures remained uneven across goods and services, and energy costs continued to stand out.
Future CPI releases will help determine whether these trends persist, particularly in core prices, shelter, food, energy and real earnings.
Frequently Asked Questions About the July 2026 CPI
What was the CPI rate in July 2026?
The CPI increased 3.4% over the 12 months ending in July 2026. On a seasonally adjusted monthly basis, the index increased 0.1% after falling 0.4% in June.
What was core inflation in July 2026?
Core Inflation, measured by the CPI index for all items less food and energy, increased 2.5% over the 12 months ending in July 2026. The core index increased 0.2% during July.

How much did food prices increase in July 2026?
The Food index increased 0.1% in July and 3.0% over the year. Food at home increased 2.7% over the year, while food away from home increased 3.4%.
Did food prices fall in July?
Some grocery categories declined in July, but the overall Food index increased 0.1%. Food at home decreased 0.1%, while food away from home increased 0.3%.
Why was headline CPI higher than core inflation?
Headline CPI includes food and energy, while Core Inflation excludes those categories. In July, energy prices were 14.7% higher than a year earlier, contributing to the difference between headline and core inflation.
What happened to gasoline prices?
Gasoline prices decreased 2.9% in July but increased 24.6% over the 12 months ending in July 2026.
Did shelter prices increase?
Yes. The shelter index increased 0.1% in July and 3.2% over the year. Shelter accounted for roughly two-thirds of the monthly increase in the all-items CPI.
Did real wages increase in July 2026?
Real average hourly earnings for all employees decreased 0.1% from June to July. Over the year, real average hourly earnings decreased 0.2%. Real average weekly earnings were unchanged over the month and increased 0.1% over the year.
What does CPI mean for economic growth?
The CPI measures consumer price changes rather than economic Growth directly. However, inflation affects household purchasing power, business costs and spending decisions, making CPI an important indicator when assessing broader economic conditions.
Is inflation falling in July 2026?
Annual headline Inflation moderated slightly, with the CPI increasing 3.4% over the year compared with 3.5% in June. Core inflation also eased from 2.6% to 2.5%.
Why can my personal inflation rate differ from CPI?
The CPI represents average price changes across a broad basket of goods and services. Individual households have different spending patterns, so their personal experience with Inflation can differ from the published CPI.
What should consumers watch in the next CPI report?
Consumers should watch Core Inflation, Food, energy, shelter and real earnings. These categories can provide additional context about household purchasing power and the direction of overall inflation.