







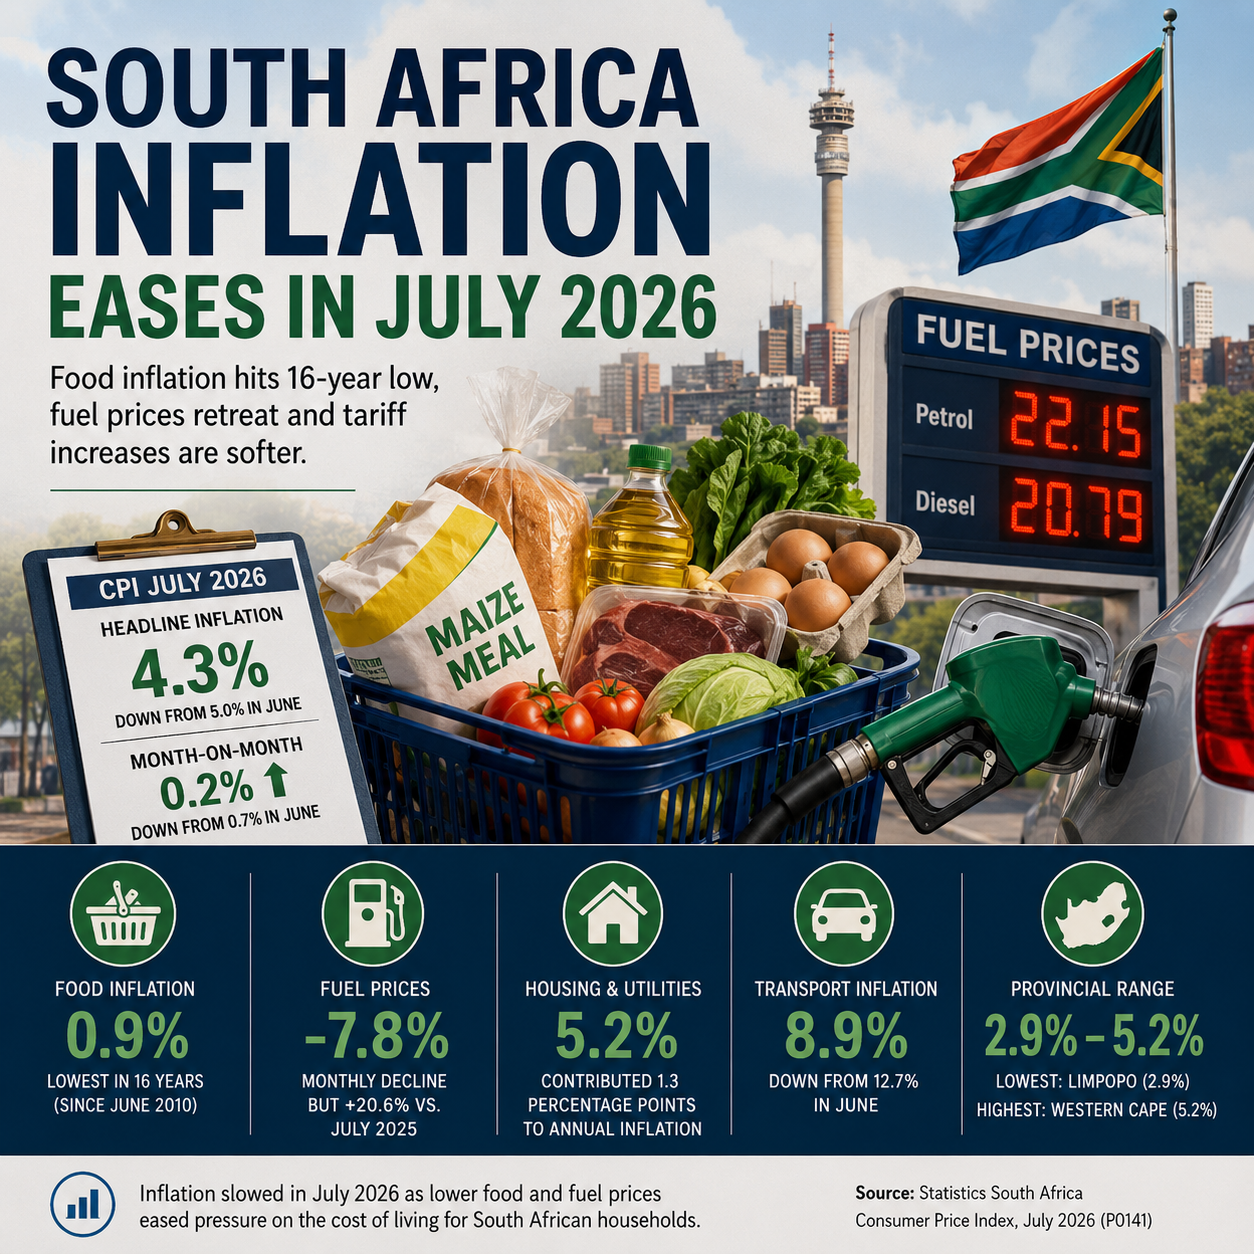
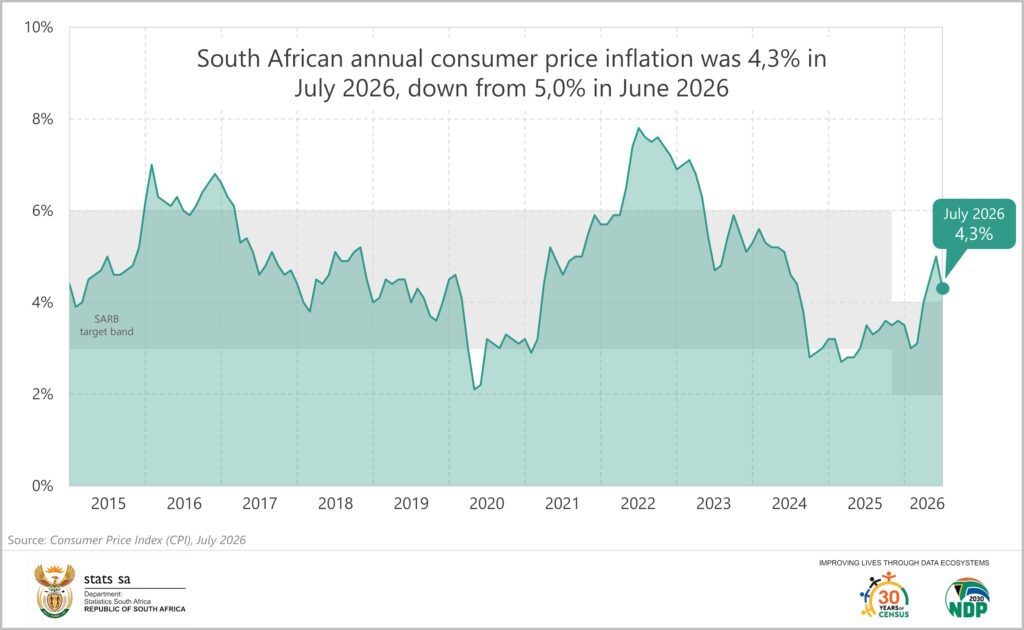
South Africa inflation slowed significantly in July 2026, with annual headline consumer inflation falling to 4.3% from 5.0% in June. Statistics South Africa reported a monthly CPI increase of just 0.2%, compared with 0.7% in June. The July result was supported by softer food and non-alcoholic beverage inflation, lower fuel prices and generally smaller increases in several municipal tariffs.
The July CPI data provides a more detailed picture than the headline number alone. Food and non-alcoholic beverage inflation dropped to 0.9%, while fuel remained expensive compared with a year earlier but recorded a substantial monthly decline. Transport inflation also slowed sharply, while housing and utilities remained one of the largest contributors to the annual inflation rate.
The result is therefore best understood as a broad moderation in the pace of price increases rather than a general fall in the cost of living. Some prices declined, particularly in selected food and fuel categories, but other household expenses continued to rise.
South Africa Inflation Falls to 4.3%
The central figure in the July release is the 4.3% annual inflation rate for all urban areas.
That was a notable change from June, when headline CPI inflation reached 5.0%. On a monthly basis, consumer prices increased by 0.2% in July, substantially below the 0.7% increase recorded in June.
The 2026 monthly inflation path also shows how quickly price pressure had changed during the year:
| Month | Annual CPI inflation |
| January 2026 | 3.5% |
| February 2026 | 3.0% |
| March 2026 | 3.1% |
| April 2026 | 4.0% |
| May 2026 | 4.5% |
| June 2026 | 5.0% |
| July 2026 | 4.3% |
The July figure therefore interrupted the increase seen from March through June. Statistics South Africa’s CPI series shows annual inflation rising from 3.1% in March to 4.0% in April, 4.5% in May and 5.0% in June before easing to 4.3% in July.
This makes July an important month for understanding the direction of South Africa inflation during the second half of 2026.
The CPI index itself increased from 107.5 in June to 107.7 in July, based on the December 2024 index base. That represents the 0.2% monthly increase in the headline CPI.
What the July CPI Figures Show
The July figures can be summarised through several important indicators.
| Indicator | July 2026 annual change | June 2026 annual change |
| Headline CPI | 4.3% | 5.0% |
| Goods | 3.4% | 4.8% |
| Services | 5.0% | 5.2% |
| Food and non-alcoholic beverages | 0.9% | — |
| Housing and utilities | 5.2% | — |
| Transport | 8.9% | — |
| Insurance and financial services | 5.7% | — |
| Administered prices | 10.9% | — |
The distinction between goods and services is particularly useful.
Goods inflation fell from 4.8% in June to 3.4% in July. Services inflation also slowed, although by a smaller amount, from 5.2% to 5.0%.
This means the moderation was not confined to one narrow part of the CPI basket. However, services remained more expensive on an annual basis than goods.
The CPI excluding food and non-alcoholic beverages, fuel and energy increased by 4.2% over the year. The trimmed mean measure increased by 3.1%. These measures provide additional ways of examining price movements beyond the headline CPI.
Why South Africa Inflation Slowed
Three developments stand out in the July data.
First, food inflation became much softer. Food and non-alcoholic beverages recorded an annual inflation rate of 0.9%, while several important food categories recorded negative annual price changes.
Second, fuel prices fell significantly between June and July. The fuel index decreased sharply on a monthly basis, helping reduce transport inflation and the overall CPI.
Third, July is an important month for municipal tariff adjustments. Although some administered prices increased, several major municipal categories recorded smaller annual increases in 2026 than in 2025.
These factors combined to reduce the pace of overall price growth.
The contribution data illustrates the change. Transport contributed 1.2 percentage points to the July annual inflation rate, down from 1.7 percentage points in June. Food and non-alcoholic beverages contributed only 0.2 percentage points, compared with 0.3 percentage points in June. Housing and utilities remained at a 1.3 percentage-point contribution.
On a monthly basis, transport made a negative contribution of 0.4 percentage points, while food and non-alcoholic beverages made no contribution to the 0.2% monthly increase. Housing and utilities, by contrast, contributed 0.5 percentage points.
Food Inflation Reaches a 16-Year Low
One of the most notable developments in the July CPI release was the decline in food inflation.
Food and non-alcoholic beverage inflation fell to 0.9%, the lowest rate recorded for the category in more than 16 years. The Statistics South Africa release notes that the previous comparable low was 0.7% in June 2010.
The result is particularly important because food occupies a meaningful share of household expenditure.
In the all-urban CPI basket, food and non-alcoholic beverages carried a weight of 18.23%. Food alone carried a weight of 16.84%.
The July data therefore indicates considerably less price pressure across the food basket than consumers experienced during periods of faster food inflation.
But the food story is not uniform.

Some categories became cheaper over the year, while others continued to record increases.
Cereal Prices Move Lower
Cereal products recorded annual inflation of -2.0% in July.
This followed an annual rate of -1.5% in June and represented a further moderation in the prices of an important group of staple products. The cereal products index also declined by 0.7% between June and July.
The detailed July release identified several individual products that recorded monthly price declines, including maize meal, macaroni and white bread.
For consumers, this matters because staple foods can have a noticeable effect on household grocery bills. Lower cereal prices can help offset increases elsewhere in the food basket.
The broader all-country tables show a similar pattern. Cereal products recorded an annual change of -2.5% for the total country measure, compared with the all-urban figure of -2.0%.
The rural data was even softer, with cereal products recording an annual decline of 4.5%.
These differences demonstrate why national averages should not automatically be interpreted as identical price experiences for every household.
Meat Inflation Slows
Meat remains one of the larger components of the food basket, but annual meat inflation slowed considerably.
In the all-urban CPI, meat prices were 1.5% higher than a year earlier in July. The monthly index decreased by 0.2%.
The underlying data shows that the movement was not identical across all meat products.
Some unprocessed beef products recorded negative annual price changes, while several processed meat products continued to record increases.
This is an important distinction when interpreting food inflation. A low aggregate food inflation rate does not mean every item in a supermarket has become cheaper. The CPI combines a large number of individual products, each with different price movements and weights.
Fruit and Vegetable Prices
Fresh produce also contributed to the softer overall food picture.
Fruits and nuts recorded an annual price decline of 7.5% in the all-urban CPI, while vegetables declined by 2.5% over the same period.
The monthly movement was also negative for fruits and nuts, with the index declining by 2.2% between June and July.
For vegetables, however, the monthly index increased by 0.3%, showing again that the direction of prices over one month can differ from the annual trend.
The all-country tables show fruits and nuts declining by 6.4% year-on-year and vegetables by 2.5%.
Not Every Food Category Fell
The low food inflation rate should not be confused with a universal decline in grocery prices.
Several food-related categories continued to record annual increases.
Fish and other seafood rose by 6.6% in the all-urban CPI. Milk, dairy products and eggs increased by 1.9%, while oils and fats rose by 2.8%. Other food products recorded a 4.4% annual increase.
Non-alcoholic beverages increased by 5.3%, with hot beverages rising 7.4% and cold beverages increasing 4.4%.
This shows why consumers can experience grocery prices differently from the headline food inflation rate.
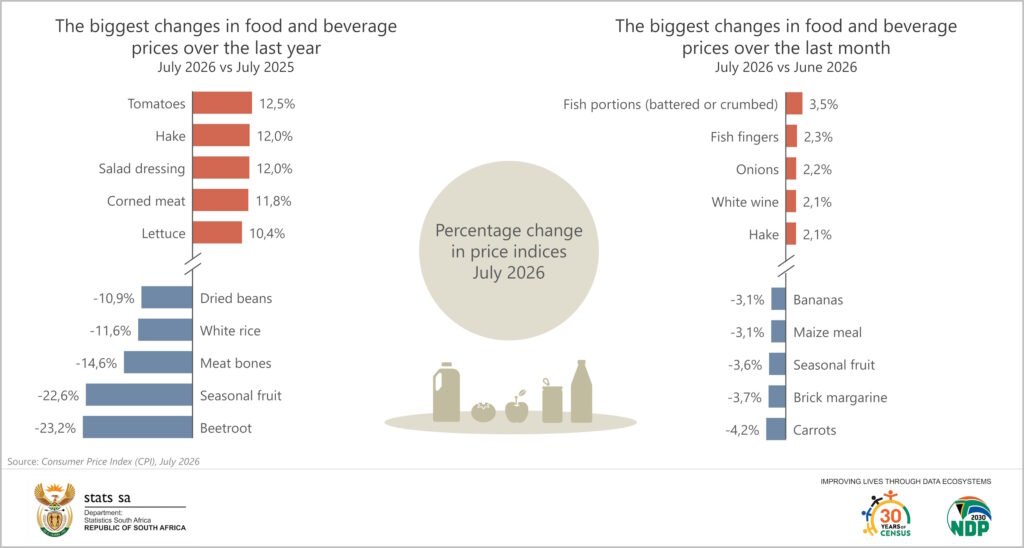
A household that spends more heavily on categories recording price increases may experience more pressure than the aggregate food CPI suggests. Conversely, households that spend more on categories with falling prices may see greater relief.
Fuel Prices Provide Major Relief
Fuel prices were another major factor behind the July reduction in South Africa inflation.
The all-urban CPI shows the fuel index falling 7.8% between June and July, while fuel remained 20.6% more expensive than a year earlier.
This distinction is critical.
Fuel prices declined sharply over the month, but they had not returned to their level of a year earlier. The annual fuel inflation rate therefore remained high even as the monthly movement became strongly negative.
The transport group recorded annual inflation of 8.9%, compared with a much higher rate of 12.7% in June.
Fuel was a major reason for that decline.
Operation of personal transport equipment increased by 16.3% year-on-year, while fuel itself increased by 20.6%. Passenger transport services increased by 11.8%.
The monthly picture was much more favourable.
Operation of personal transport equipment declined by 5.9% between June and July, while the fuel index fell by 7.8%.
The national total-country tables show a very similar result, with fuel down 7.9% month-on-month and still 20.7% higher than a year earlier.
That combination helps explain why transport’s contribution to monthly headline inflation turned negative.
Housing and Utilities Remain Important
While food and fuel provided relief, housing and utilities remained a significant source of inflation.
Housing and utilities recorded annual inflation of 5.2% in the all-urban CPI and contributed 1.3 percentage points to the headline inflation rate.
The group recorded a substantial monthly increase of 2.2%.
Several components contributed to the movement.
Water supply and miscellaneous services increased by 6.0% between June and July and were 6.4% higher than a year earlier. Electricity, gas and other fuels increased by 7.0% during the month and 8.3% over the year.
Actual rentals for housing were unchanged from June and increased 4.1% over the year.
Owners’ equivalent rent was also unchanged month-on-month and increased 4.0% year-on-year.
The additional housing tables provide more detail. Actual rentals for houses increased 3.7% year-on-year, while townhouses increased 5.4% and flats increased 4.6%. Owners’ equivalent rent for houses increased 3.9%, townhouses 6.1% and flats 3.6%.
These figures show that housing-related inflation remained an important part of the July CPI picture even as overall inflation slowed.
Municipal Tariffs Change the July Inflation Picture
July is particularly important in the CPI calendar because several municipal charges are surveyed during the month.
Statistics South Africa’s survey schedule identifies July as the month in which municipal charges for water supply, assessment rates, electricity, sewage removal and refuse collection are surveyed.
The 2026 increases were generally softer than those recorded in 2025 for several major categories.
Electricity tariffs increased by 8.1% in 2026, compared with 10.4% in 2025.
Water tariffs increased by 10.2%, compared with 12.1% in 2025.
Refuse removal increased by 4.7%, compared with 6.6% in 2025.
Sewerage charges were an exception, rising 7.8% compared with 6.5% in 2025.
Property assessment rates increased by 4.9% in both years.
The administered-price contribution tables show the importance of these changes. Electricity contributed 2.2 percentage points to the annual administered-price CPI in July, while water contributed 0.9 percentage points, assessment rates 0.6 percentage points and sewage removal 0.2 percentage points.
At the same time, fuel’s contribution to administered-price inflation fell from 10.0 percentage points in June to 5.9 percentage points in July.
This helps explain the unusual combination of a strong monthly increase in some administered prices alongside an overall decline in headline inflation.
Transport Inflation Falls Sharply
Transport was one of the most important contributors to the decline in South Africa inflation.
Annual transport inflation slowed from 12.7% in June to 8.9% in July.
The transport group has a weight of 13.89% in the all-urban CPI basket, making its price movements significant for the overall index.
Fuel prices were the principal source of relief.
The transport index fell 2.7% month-on-month, while fuel fell 7.8%. Operation of personal transport equipment fell 5.9%.
Passenger transport services also declined by 0.9% during July, although they remained 11.8% above their level a year earlier.
The contribution data makes the change especially clear. Transport contributed 1.7 percentage points to annual CPI inflation in June but only 1.2 percentage points in July.
For the monthly CPI, transport moved from a positive contribution of 0.4 percentage points in June to a negative contribution of 0.4 percentage points in July.
That was a substantial swing.
Services Inflation Remains Higher Than Goods Inflation
Although the headline CPI fell, services continued to record a higher annual inflation rate than goods.
Goods inflation fell to 3.4%, from 4.8% in June.
Services inflation declined to 5.0%, from 5.2%.
This difference is useful because goods prices can respond relatively quickly to movements in fuel, food and other physical inputs, while many services involve costs such as housing, insurance, education and financial services.
Several services-related categories continued to record relatively firm annual increases.
Education services rose 5.4% year-on-year. Primary and secondary education increased 6.2%, while tertiary education increased 4.2%.
Restaurants and accommodation services increased 5.2%.
Within this category, restaurant catering services rose 5.9%, while accommodation services increased 2.7%.
Insurance and financial services increased 5.7%, with insurance itself rising 5.9% and financial services 4.8%.
These figures show that lower food and fuel inflation does not automatically translate into equally low inflation across services.
Provincial Inflation Rates Tell a Different Story
National CPI figures provide an important benchmark, but inflation differs considerably across provinces.
The July all-urban provincial data shows:
| Province | Annual CPI inflation, July 2026 |
| Western Cape | 5.2% |
| Free State | 4.3% |
| Eastern Cape | 4.1% |
| Gauteng | 4.1% |
| North West | 3.8% |
| KwaZulu-Natal | 3.6% |
| Northern Cape | 3.5% |
| Mpumalanga | 3.7% |
| Limpopo | 2.9% |
The highest provincial rate was recorded in the Western Cape at 5.2%, while Limpopo recorded the lowest at 2.9%.
Gauteng, which carries a large expenditure weight in the CPI structure, recorded annual inflation of 4.1%.
The Western Cape’s higher inflation rate was associated with stronger price growth in several categories. Its food and non-alcoholic beverage inflation was 2.7%, while housing and utilities increased 7.0% and transport increased 10.0%.
Fuel in the Western Cape remained 21.4% above its level a year earlier, even though the monthly fuel index fell 7.9%.
This provincial variation reinforces an important point: the national inflation rate is an average measure, not a precise measure of every household’s personal inflation experience.
Rural and Urban Inflation Differ
The additional CPI tables also show a significant difference between rural and urban price movements.
Rural CPI inflation was 2.8% in July, compared with 4.3% for all urban areas.
The rural food and non-alcoholic beverage category recorded an annual decline of 0.6%, while food itself declined 1.0%.
Cereal products fell 4.5% year-on-year in rural areas, while vegetables declined 2.5%.
Housing and utilities in rural areas increased 4.8%, while transport increased 8.1%.
The difference between rural and urban inflation illustrates the importance of expenditure patterns and geographic price differences in interpreting CPI statistics.
The CPI is designed to represent average household expenditure patterns. Individual households may have a different spending mix, which can produce a personal inflation rate above or below the national figure.
Inflation Across Household Expenditure Deciles
The July data also provides a useful view of inflation across expenditure deciles.
For the all-urban CPI, annual inflation varied from 2.9% for expenditure decile 1 to 4.6% for expenditure decile 10.
The pattern was:
| Expenditure decile | Annual CPI inflation |
| 1 | 2.9% |
| 2 | 2.8% |
| 3 | 3.0% |
| 4 | 3.2% |
| 5 | 3.3% |
| 6 | 3.5% |
| 7 | 3.6% |
| 8 | 4.1% |
| 9 | 4.5% |
| 10 | 4.6% |
The lowest expenditure deciles recorded lower annual CPI increases than the highest expenditure groups in July.
The CPI release identifies the expenditure thresholds used for the deciles. Decile 1 covers expenditure up to R35,864, while decile 10 represents expenditure of R307,886 and more.
These figures should not be interpreted as a measure of household welfare by themselves. They show how the CPI differs across expenditure groups based on the basket structures used in the statistical system.
The important point is that the headline inflation rate does not affect every household in exactly the same way.
Other Household Costs Still Rising
The July CPI data shows several categories where annual price increases remained noticeable.
Health costs increased 3.7% year-on-year in the all-urban CPI. Medicines and health products increased 2.6%, while health services increased 4.7%.
The additional medical industry tables show medical insurance increasing 8.3% year-on-year. The broader health index including medical insurance increased 7.3%.
Education was another area with relatively firm price growth.
Education services increased 5.4%, while primary and secondary education rose 6.2%. University boarding fees increased 7.2%, according to the detailed tables.
Restaurants and accommodation services rose 5.2%.
Insurance and financial services rose 5.7%.
These categories help explain why the moderation in headline inflation did not necessarily mean that all recurring household expenses became less expensive.
What the CPI Data Means for South African Households
The July CPI release contains both positive and mixed signals for consumers.
The positive side is clear in several areas.
Food inflation is much lower than it was during periods of elevated food-price growth. Cereal products, fruits and nuts and vegetables recorded annual declines in the all-urban basket. Fuel prices also declined sharply between June and July.
For households that spend heavily on groceries and private transport, these developments can provide some relief.
However, the annual fuel price remains substantially higher than it was a year earlier. Housing and utilities continue to rise. Insurance, education, restaurant services and some other categories also recorded relatively firm annual increases.
The result is a mixed household-cost environment.
The most accurate interpretation is therefore not that prices are falling broadly. Rather, the rate at which consumer prices are increasing has slowed, with some individual categories actually recording price declines.
That distinction is central to understanding inflation.
What the July CPI Data Does Not Mean
A lower inflation rate does not mean the average price level has fallen.
For example, if an item rises from R100 to R110 and then remains at R110, its inflation rate eventually falls to zero even though the item is still more expensive than it was originally.
The same principle applies to the CPI.
The July CPI index was 107.7, compared with 103.3 in July 2025. The index therefore remained higher than a year earlier even though the annual inflation rate had fallen to 4.3%.
The lower inflation rate indicates that prices are rising more slowly than before.
It does not mean that the price increases of previous years have been reversed.
The distinction is particularly relevant for households managing long-term budgets. Lower inflation can reduce the speed of new price increases, but it does not automatically restore purchasing power lost during earlier periods of high inflation.
The South Africa Inflation Trend in 2026
The 2026 CPI sequence shows a clear acceleration during the first half of the year followed by a July moderation.
Annual inflation started at 3.5% in January and fell to 3.0% in February. It remained close to that level in March at 3.1%.
The rate then increased to 4.0% in April, 4.5% in May and 5.0% in June.
July reversed part of that increase, with inflation declining to 4.3%.

This makes July an important data point, but it is too early to conclude from one month that inflation will continue falling at the same pace.
The next CPI releases will show whether the July developments represent a sustained change or a temporary easing influenced by food, fuel and administered-price movements.
Statistics South Africa’s release schedule states that the August 2026 CPI release is expected on 23 September 2026.
That release will provide the next major indication of whether the July improvement is continuing.
A Closer Look at Administered Prices
Administered prices deserve particular attention because they include goods and services whose prices are directly or significantly influenced by government or government agencies.
Statistics South Africa defines administered prices as prices set directly or significantly influenced by government rather than relying solely on market forces. The category includes items such as water, refuse collection, sewage removal, assessment rates, electricity, petrol, diesel, public transport fares and certain education and health-related charges.
In July, CPI for administered prices increased 10.9% year-on-year.
That was still considerably higher than headline CPI inflation of 4.3%.
The monthly administered-price index increased 1.1%.
The contribution table shows that electricity was the largest annual administered-price contributor at 2.2 percentage points, followed by fuel at 5.9 percentage points, water at 0.9 percentage points and assessment rates at 0.6 percentage points.
Fuel’s annual contribution declined significantly from June, reflecting the monthly fall in fuel prices.
This demonstrates why the administered-price category can remain elevated even while headline inflation declines.
How Food, Fuel and Housing Interacted in July
The July CPI result can be understood as the interaction of three broad forces.
Food provided stability.
Food and non-alcoholic beverages contributed 0.2 percentage points to annual headline inflation and made no contribution to the monthly increase.
Fuel provided monthly relief.
Fuel prices fell sharply between June and July, pushing transport inflation lower and making a negative contribution to monthly headline CPI.
Housing and utilities added pressure.
Housing and utilities contributed 0.5 percentage points to the monthly CPI increase and 1.3 percentage points to the annual inflation rate.
The result was a relatively small overall monthly CPI increase of 0.2%.
This combination is more informative than looking at the headline number alone.
Why the 4.3% Inflation Rate Matters
The 4.3% July reading is important because it represents a meaningful reduction from the 5.0% recorded in June.
It also places inflation back closer to the levels recorded earlier in 2026.
However, the data shows that inflation remains uneven.
Food inflation is exceptionally low.
Fuel inflation remains high on a year-on-year basis despite the monthly decline.
Housing and utilities remain above headline CPI.
Services inflation is also higher than goods inflation.
Provincial inflation varies considerably.
These differences mean that the July CPI release should be viewed as evidence of moderation rather than as a uniform decline in living costs.
Key Takeaways From July 2026 CPI
The July 2026 CPI release provides several clear conclusions.
1. South Africa inflation fell to 4.3%
Annual headline CPI declined from 5.0% in June to 4.3% in July. Monthly CPI increased by only 0.2%.
2. Food inflation became exceptionally low
Food and non-alcoholic beverage inflation declined to 0.9%, the lowest rate for the category in more than 16 years.
3. Some staple food prices declined
Cereal products fell 2.0% year-on-year in the all-urban CPI. Fruits and nuts declined 7.5%, while vegetables fell 2.5%.
4. Fuel prices fell sharply during July
The fuel index fell 7.8% month-on-month but remained 20.6% above its level a year earlier.
5. Transport inflation slowed
Transport inflation fell from 12.7% in June to 8.9% in July.
6. Housing remained a major source of inflation
Housing and utilities increased 5.2% year-on-year and contributed 1.3 percentage points to annual headline inflation.
7. Provincial inflation varied widely
Western Cape recorded the highest provincial rate at 5.2%, while Limpopo recorded the lowest at 2.9%.
8. Rural inflation was lower
Rural CPI inflation was 2.8% in July, below the 4.3% rate for all urban areas.
9. Goods inflation slowed more than services inflation
Goods inflation declined to 3.4%, while services inflation was 5.0%.
10. Lower inflation does not mean prices have broadly fallen
The July result means the pace of price increases slowed. It does not reverse previous increases in the overall price level.
Frequently Asked Questions About South Africa Inflation
What was South Africa inflation in July 2026?
South Africa inflation was 4.3% in July 2026, according to Statistics South Africa. This was down from 5.0% in June 2026. The CPI increased by 0.2% month-on-month in July.

Why did inflation fall in July 2026?
The July slowdown was associated with softer food and non-alcoholic beverage inflation, lower fuel prices and changes in municipal tariffs. Transport inflation also declined sharply during the month.
What was food inflation in South Africa in July 2026?
Food and non-alcoholic beverage inflation was 0.9% in July 2026. Statistics South Africa described this as the lowest rate for the category in more than 16 years. Food itself increased by only 0.6% in the all-urban CPI.
Did food prices fall in July 2026?
Some food prices fell, but not all. Cereal products, fruits and nuts, and vegetables recorded annual declines in the all-urban CPI. Other categories, including fish and seafood, dairy products and eggs, oils and fats, and non-alcoholic beverages, still recorded annual increases.
What happened to fuel prices in July 2026?
Fuel prices fell significantly between June and July. The fuel index declined 7.8% month-on-month. Despite this monthly fall, fuel remained 20.6% more expensive than a year earlier.
What was transport inflation in July 2026?
Transport inflation was 8.9% in July, down from 12.7% in June. The decline was mainly associated with lower fuel prices.
Which province had the highest inflation in July 2026?
The Western Cape recorded the highest provincial inflation rate at 5.2% in July 2026. Limpopo recorded the lowest at 2.9%.
Was rural inflation lower than urban inflation?
Yes. Rural CPI inflation was 2.8% in July 2026, compared with 4.3% for all urban areas. Rural food inflation was also negative at -1.0%.
What contributed most to South Africa inflation in July?
Housing and utilities contributed 1.3 percentage points to annual headline inflation, transport contributed 1.2 percentage points and insurance and financial services contributed 0.6 percentage points.
Does lower inflation mean the cost of living is falling?
Not necessarily. A lower inflation rate means prices are increasing more slowly. It does not mean the overall price level has returned to previous levels. Some individual prices may fall while others continue increasing.
When is the next CPI release?
Statistics South Africa’s release schedule indicates that the August 2026 CPI release is expected on 23 September 2026.
Conclusion: South Africa Inflation Shows Signs of Moderation
The July 2026 CPI figures provide a clearer and more balanced picture of the inflation environment in South Africa.
Headline inflation fell to 4.3% from 5.0% in June, while monthly CPI increased by just 0.2%. The decline was supported by much softer food inflation and a substantial monthly reduction in fuel prices.
The food story is particularly notable. Food and non-alcoholic beverage inflation fell to 0.9%, with cereal products, fruits and nuts and vegetables recording annual declines in the all-urban CPI.
Fuel prices also moved in a favourable direction during July, falling 7.8% month-on-month. However, fuel remained 20.6% more expensive than a year earlier, showing that the monthly improvement should not be confused with a complete reversal of earlier price increases.
Housing and utilities remained a major source of inflation, while services continued to record a higher annual inflation rate than goods.
The provincial figures further demonstrate the uneven nature of price changes. Inflation ranged from 2.9% in Limpopo to 5.2% in the Western Cape. Rural inflation was 2.8%, below the 4.3% all-urban rate.
Overall, the July figures indicate that South Africa inflation has eased after rising through much of the first half of 2026. Whether this moderation continues will depend on how food, fuel, housing, services and administered prices develop in the months ahead.
For households, the most important message is that the inflation rate has slowed, but the cost of living remains shaped by a wide range of individual price movements. Some categories are providing relief, while others continue to rise at rates above headline CPI.
The next CPI releases will therefore be important for determining whether the July improvement marks the beginning of a more sustained period of lower inflation or simply a temporary moderation in the annual rate.