









NFP Jobs and Canada Labour Data Point to a More Uneven Labour Market
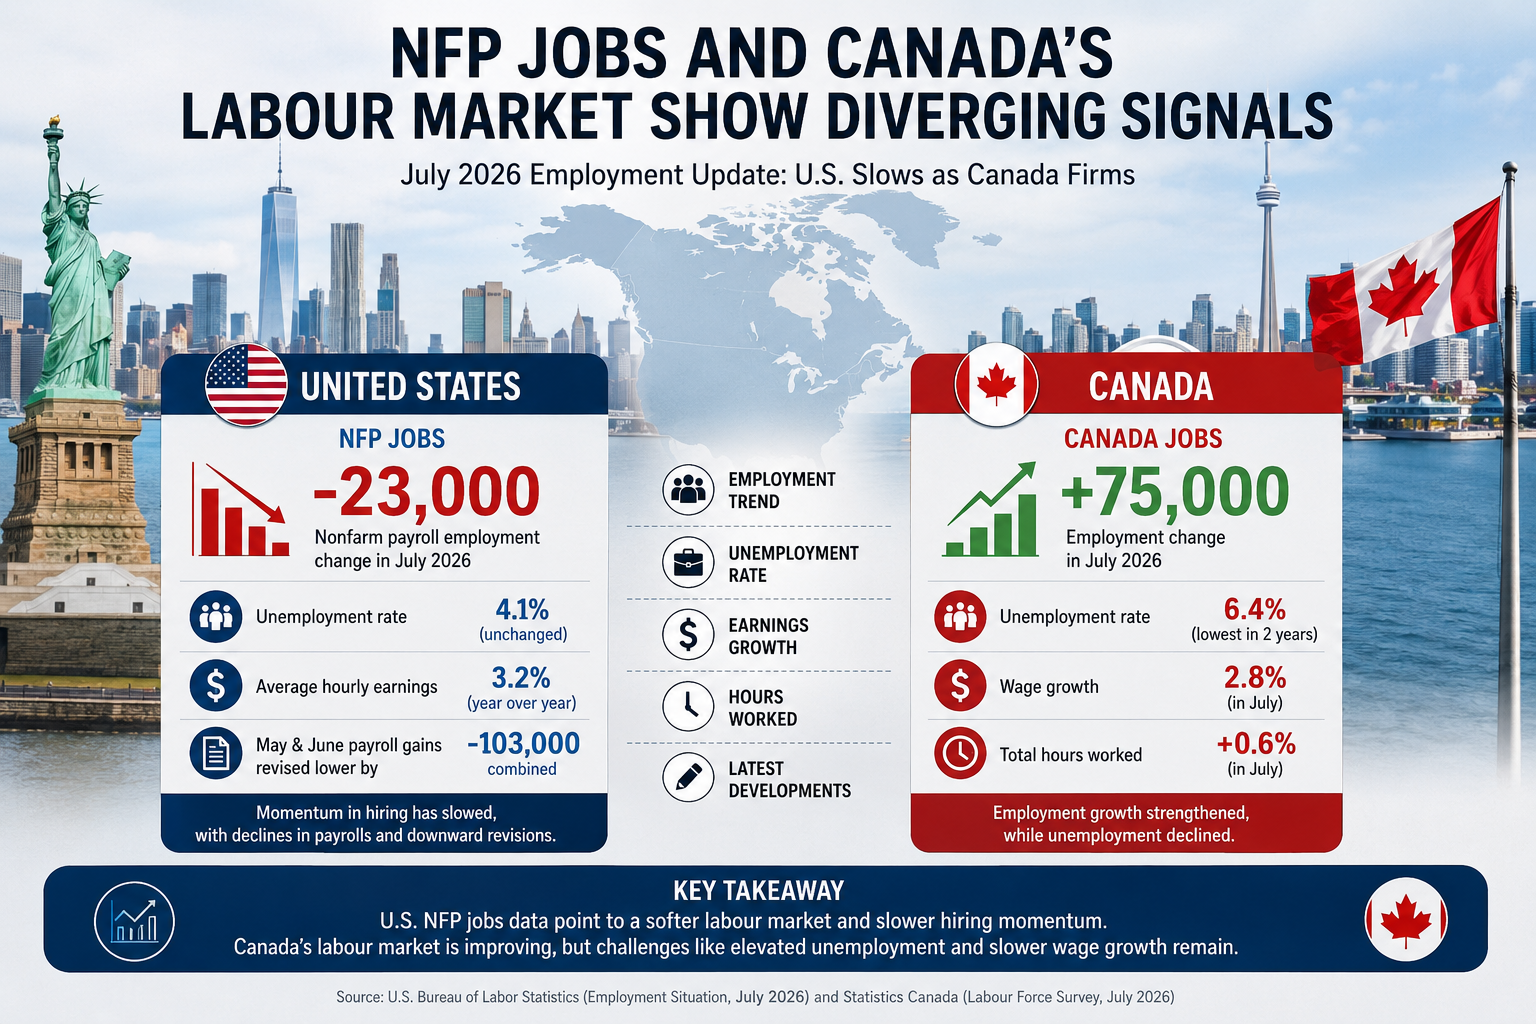
NFP Jobs data for July delivered a softer reading on the U.S. labour market, while Canada’s latest employment report offered a more constructive picture. U.S. nonfarm payroll employment fell by 23,000 in July, according to the Bureau of Labor Statistics, while the unemployment rate held at 4.1%. Canada, by contrast, added 75,000 jobs in July and saw its unemployment rate decline to 6.4%, according to the figures supplied for this analysis.
The difference is notable, but it does not necessarily mean that the Canadian labour market is stronger across every measure or that the U.S. labour market has suddenly deteriorated. The two economies have different labour-force dynamics, population trends, industry structures and statistical measures.
The July NFP Jobs report instead points to a U.S. labour market that has lost momentum, with revisions to earlier payroll figures making the recent trend less robust than previously thought. Canada is showing better employment momentum, although its unemployment rate remains elevated and wage growth has slowed.
That combination makes the latest North American labour data more useful as a study in divergence than as a simple story of strength versus weakness.
In the U.S., payroll employment declined by 23,000 in July, while the unemployment rate remained at 4.1%. The BLS also reported that May and June payroll gains were revised lower by a combined 103,000. May was revised from a 129,000 increase to 63,000, while June was revised from 57,000 to 20,000.
Canada’s figures moved in the opposite direction. Employment rose by 75,000 in July after gains of 18,000 in May and 88,000 in June, based on the Canadian labour-market data supplied for this article. The unemployment rate fell to 6.4%, its lowest level in two years.
The important question for investors, businesses and policymakers is therefore not simply whether NFP Jobs increased or declined. It is whether the underlying employment trend is consistent with a broader change in economic growth, labour supply, consumer demand and wage pressure.
The July numbers suggest a more complicated picture.
U.S. NFP Jobs Declined by 23,000 in July
The headline figure in the July U.S. employment report was straightforward: nonfarm payroll employment fell by 23,000.
That result contrasts with the average monthly payroll gain of 34,000 over the previous 12 months. The latest NFP Jobs result therefore represents a noticeable loss of momentum, particularly when considered alongside the downward revisions to May and June.
The establishment survey showed total nonfarm employment at a relatively weak point in July. Private employment actually increased by 30,000, but that gain was more than offset by a 53,000 decline in government employment.
Local government education accounted for a 50,000 employment decline. Retail trade also contracted, losing about 19,000 jobs.
The composition matters because the overall NFP Jobs number can obscure important differences between sectors.
Health care remained one of the more consistent sources of employment growth. Health-care employment increased by 22,000 in July, although that was below its average monthly gain of 36,000 over the prior 12 months.
That slowdown does not indicate that the sector has stopped expanding. Rather, it shows that even areas that have supported U.S. employment growth are beginning to produce smaller monthly increases.
Other major industries were broadly stable during the month. Mining and logging, construction, manufacturing, wholesale trade, transportation and warehousing, information, professional and business services, social assistance, leisure and hospitality and other services showed little overall change.
The result is a U.S. employment market in which growth is becoming more concentrated and less broad-based.
That is an important distinction when assessing NFP Jobs.
A single negative headline number does not automatically establish a recessionary trend. But a combination of modest payroll growth, downward revisions and weaker breadth can signal that companies are becoming more cautious about adding workers.
NFP Growth Has Become More Difficult to Read
The concept of NFP Growth is more important than the single monthly headline.
The U.S. employment report is a monthly snapshot, and preliminary estimates are routinely revised as additional information becomes available. The July report provides a clear example of why the trend should be considered alongside revisions.
May payroll growth was revised down by 66,000, from 129,000 to 63,000. June was revised down by 37,000, from 57,000 to 20,000. Together, the revisions reduced employment growth in those two months by 103,000 from previously reported levels.
That means the recent NFP Jobs trajectory is weaker than investors would have concluded from the earlier releases.
Revisions are not unusual. The establishment survey is based on information collected from businesses and government agencies, and additional responses become available after the first estimate is published. Seasonal factors are also recalculated.
The BLS states that the most recent two months are preliminary and normally undergo two subsequent revisions before becoming final.
For that reason, the July NFP Jobs number should be treated as an important signal rather than a final verdict on the labour market.
Still, revisions can change the interpretation of the trend.
If payroll growth is repeatedly revised lower, it can indicate that the initial picture of labour-market strength was too optimistic. That matters for forecasts of household income, consumer spending, economic growth and monetary policy.
The July data therefore deserve attention not only because payrolls declined, but because the underlying sequence of recent employment gains is weaker after revisions.
Unemployment Held at 4.1% in the U.S.
The NFP Jobs report is only one part of the employment picture.
The household survey showed that the U.S. unemployment rate remained at 4.1% in July. The number of unemployed people was approximately 6.9 million, also little changed during the month.
That stability provides an important counterweight to the decline in payroll employment.
The unemployment rate is based on the household survey rather than the establishment survey. These are separate statistical programs with different samples and methodologies.
The household survey measures employment status, unemployment and labour-force participation among individuals. The establishment survey measures payroll employment, hours and earnings from business and government establishments.
The two surveys can therefore move differently in a given month.

In July, the household survey showed employment declining by 87,000, while unemployment fell by 178,000. The labour force also declined by 264,000. The labour-force participation rate edged down to 61.4% from 61.5% in June.
The employment-population ratio also slipped to 58.9%.
These figures reinforce the idea that the U.S. labour market is not simply experiencing a sharp rise in unemployment. Instead, the data show softer employment, a smaller labour force and a stable unemployment rate.
That distinction is important.
A stable unemployment rate can coexist with weaker job creation if labour-force participation also changes. Consequently, analysts looking at NFP Jobs should consider the unemployment rate, participation rate and employment-population ratio together.
Canada Jobs Moved Higher in July
The Canadian picture was notably firmer.
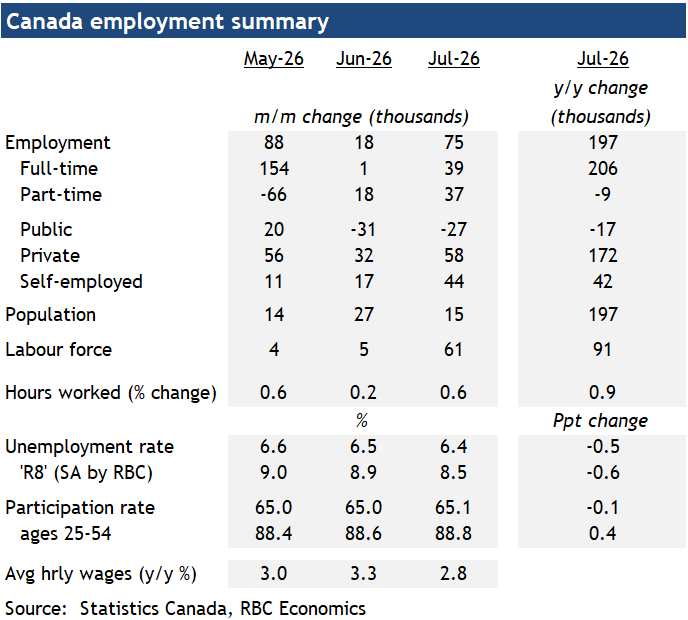
Employment increased by 75,000 in July, building on gains of 18,000 in May and 88,000 in June, according to the Canadian labour-market figures supplied for this analysis.
That sequence represents a meaningful improvement after a weak start to 2026.
Year-to-date employment growth reached 68,000, although the average monthly increase remains modest because of the softer beginning to the year.
The composition of Canada’s July employment increase also provides useful context.
Full-time employment increased by approximately 38,600, while part-time employment rose by about 36,600. Despite the balanced July result, the year-to-date employment increase has been entirely driven by full-time jobs, with full-time employment up approximately 82,000.
That distinction makes the Canada Jobs data more constructive than the headline alone suggests.
Full-time employment is generally more relevant when assessing the underlying capacity of household income and labour utilization, although the distinction should not be overstated. Part-time work remains an important component of the labour market and can reflect both worker preferences and employer demand.
The Canadian numbers also need to be considered alongside population trends.
Population growth has slowed sharply, partly reflecting immigration restrictions, while worker retirements remain elevated as the Canadian workforce ages.
That creates an unusual situation in which moderate employment growth can have a more meaningful impact on labour-market conditions than the headline number alone might suggest.
Canada’s Unemployment Rate Fell to 6.4%
The Canadian unemployment rate declined to 6.4% in July, its lowest level in two years.
That represents a significant improvement from the 6.9% high recorded in April 2026 and the 7.1% recent peak in August and September 2025.
The decline in unemployment strengthens the interpretation of the July Canada Jobs report.
Employment increased while the unemployment rate declined, suggesting an improvement in per-worker labour-market conditions.
At the same time, the 6.4% unemployment rate remains relatively high. The Canadian labour market should therefore not be described as fully recovered or exceptionally strong.
The youth unemployment rate was little changed at 12.6% in July compared with 12.7% in June. However, the youth rate was nearly two percentage points below its level a year earlier.
For workers aged 25 to 54, the unemployment rate edged down to 5.5% from 5.6%.
The data therefore show improvement across several important labour-market measures, but not an across-the-board return to tight conditions.
That is particularly relevant when comparing Canada Jobs with NFP Jobs.
The U.S. unemployment rate is considerably lower at 4.1%, but payroll growth has weakened. Canada has a much higher unemployment rate at 6.4%, yet employment growth has strengthened.
The two economies are therefore operating at different points in their respective labour-market cycles.
NFP Earnings Show Continued Wage Growth
Employment is only one part of the economic picture.
The other major issue is NFP Earnings, particularly average hourly earnings and the pace at which labour income is changing.
In the U.S., average hourly earnings for private-sector employees reached $37.62 in July, up two cents from June. Over the year, average hourly earnings increased by 3.2%.
Average weekly hours remained unchanged at 34.3 hours.
Average weekly earnings increased to approximately $1,290.37, compared with $1,289.68 in June.
The overall message from NFP Earnings is therefore one of continued wage growth rather than acceleration.
A 3.2% annual increase is meaningful for household incomes, but the absence of stronger monthly wage growth suggests that wage pressures are not intensifying sharply.
That matters for inflation expectations and monetary policy.
If employment growth is slowing while wage growth remains moderate, the labour market can gradually become less inflationary without necessarily producing a severe deterioration in household finances.
The July NFP Earnings numbers fit that description.
Wages are still increasing, but the labour market does not appear to be generating a new acceleration in compensation.
Canadian Wage Growth Slowed in July
Canada’s wage picture was less supportive.
According to the Canadian data supplied, wage growth slowed to 2.8% in July from 3.3% in June.
That creates an important contrast with the employment figures.
Canada added 75,000 jobs and unemployment declined, but wage growth slowed.
That combination suggests the improvement in labour-market conditions has not yet translated into stronger wage pressure.
There are several possible explanations for that pattern, including elevated unemployment, available labour supply and changing composition across industries. The supplied analysis notes that unemployment remains above normal and is expected to keep wage growth under pressure in the near term.
The distinction is important for interpreting Canada Jobs.
A stronger employment headline does not necessarily mean that workers are gaining bargaining power rapidly.
If employment increases while wage growth slows, businesses may have more access to available workers than the headline job gains suggest.
That is one reason the Canadian report should be viewed as an improvement rather than a signal of an overheated labour market.
Canada’s Labour Supply Is Changing
One of the most important features of the Canadian labour market is the interaction between employment growth and labour supply.
Population growth among people aged 15 and older increased by approximately 15,000 in July, according to the Canadian data supplied for this analysis.
At the same time, population growth has slowed substantially because of tighter immigration policies.
Worker retirements are also elevated.
The supplied figures indicate that approximately 26,000 workers per month retired over the last year as of July.
Those demographic forces matter because employment growth is not occurring against a fixed labour supply.
If the working-age population grows more slowly, even relatively modest job creation can produce a more noticeable improvement in unemployment and labour-market conditions.
Retirements can have the opposite effect on the available workforce by reducing participation.
Canada’s labour-force participation rate was 65.1% in July, down 0.1 percentage point from a year earlier.
The decline was largely related to retirement patterns. Participation among people aged 15 to 24 increased by 0.6 percentage point, while the rate for those aged 25 to 54 increased by 0.4 percentage point.
That suggests the headline participation rate does not fully capture the changes taking place inside the Canadian workforce.
The demographic composition of labour supply is becoming increasingly important to the interpretation of Canada Jobs.
Hours Worked Add to the Canadian Growth Signal
Total hours worked in Canada increased by another 0.6% in July.
That followed increases of 0.2% in June and 0.6% in May.
Hours worked are useful because they provide another measure of labour utilization beyond the number of people employed.
A rise in both employment and hours can provide a stronger indication of economic momentum than employment alone.
The July increase in hours is also consistent with signs of improved economic activity during the second quarter.
That does not prove that Canadian economic growth will accelerate materially in the second half of the year. But it provides evidence that the labour-market improvement is not limited to a single payroll count.
The stronger hours data also provide some support for the argument that the Canadian economy is moving away from the softer conditions seen earlier in the year.
However, wage growth remains a limiting factor.
If hours increase but wage growth slows, aggregate labour income may not accelerate as rapidly as the employment figures suggest.
For businesses and investors, that means Canada Jobs should be evaluated alongside hours, wages, unemployment and productivity.
Ontario Led Canada’s July Employment Increase
The geographic distribution of Canada Jobs was also notable.
Ontario accounted for approximately two-thirds of the national employment increase in July, with employment rising by 52,000.
The province’s unemployment rate declined to 6.8%, its lowest level in two years.
British Columbia also recorded an employment increase of approximately 18,000.
Manitoba added about 5,900 jobs, while Nova Scotia employment increased by approximately 4,600.
These gains were accompanied by falling unemployment rates in several provinces.
Quebec’s labour market remained subdued, while Alberta paused following strong employment increases over the previous 12 months.

The provincial distribution matters because Canada’s labour market is not uniform.
A national employment increase can be heavily influenced by one or two large provinces, while other regions experience little change.
Ontario’s contribution therefore deserves particular attention when assessing the July Canada Jobs report.
The concentration of employment gains also raises questions about how durable the improvement will be.
If job growth broadens across provinces in coming months, the July report could prove to be part of a wider strengthening trend. If the gains remain concentrated, the national improvement may be less evenly distributed.
NFP Jobs and Canada Jobs Are Sending Different Signals
The contrast between U.S. NFP Jobs and Canada Jobs is one of the clearest themes in the latest data.
The U.S. labour market is larger and has a substantially lower unemployment rate, but payroll growth has slowed and recent estimates have been revised lower.
Canada has a higher unemployment rate, but employment growth has strengthened and unemployment has declined.
The comparison can be summarized as follows:
| Labour Market Measure | United States | Canada |
|---|---|---|
| July employment change | -23,000 NFP payrolls | +75,000 jobs |
| Unemployment rate | 4.1% | 6.4% |
| Recent unemployment trend | Little changed | Declining |
| Wage growth | 3.2% year over year | 2.8% in July |
| Key July development | Payrolls declined | Employment increased |
| Major labour-market issue | Slower payroll momentum | Elevated unemployment and demographics |
| Hours | Private-sector workweek 34.3 hours | Total hours worked +0.6% |
The figures should not be read as a direct ranking of the two economies.
The U.S. and Canadian labour markets have different structures, population dynamics and statistical definitions.
Instead, the divergence is useful because it demonstrates how employment cycles can vary even between two closely integrated economies.
The U.S. data suggest slower hiring momentum.
Canada’s data suggest improving employment conditions despite a still-elevated unemployment rate.
Why the U.S. and Canada Can Diverge
The two economies remain highly integrated, particularly through trade, manufacturing, energy and cross-border supply chains.
Yet labour markets can respond differently to the same external pressures.
One factor is the structure of employment.
The U.S. labour market has a much larger services sector, and the July NFP Jobs report showed significant variation across health care, retail, government education and financial activities.
Canada’s labour market is more directly influenced by its population growth, immigration patterns and the aging of its workforce.
Demographic changes can therefore have a larger influence on the Canadian unemployment rate and participation rate.
Trade uncertainty is another factor.
Canada continues to face uncertainty surrounding U.S. tariffs and the future of North American trade arrangements. However, the supplied Canadian analysis notes that CUSMA continues to provide a framework for duty-free trade for most Canadian exports to the United States.
That provides an important buffer even as tariff risks remain.
Energy prices also matter.
Canada’s economy has significant exposure to energy markets, and elevated energy prices can influence investment, income and regional employment.
The supplied analysis indicates that energy prices remained elevated but had eased from higher second-quarter levels.
The broader economic-growth picture is also relevant.
The Canadian economy showed signs of improving momentum in the second quarter after weakness during the winter.
The U.S. data, meanwhile, suggest that employment growth has become less reliable.
This does not establish a recession in either economy, but it does create a more uneven North American outlook.
What NFP Jobs Mean for Economic Growth
The connection between NFP Growth and broader economic growth is not automatic.
Employment is an important component of household income and consumer demand. More jobs can support spending, while weaker hiring can reduce the pace of income growth.
But the quality and composition of employment matter.
A rise in full-time jobs can have a different economic effect from a rise concentrated in part-time work.
Hours worked can provide additional information about how much labour is actually being used.
Wages determine how much income households receive from employment.
And productivity determines how efficiently that labour translates into economic output.
The July U.S. report therefore provides a mixed signal.
Payroll employment fell, but unemployment remained stable and wages continued to increase.
The Canadian report was more positive on employment and hours, but wage growth slowed.
Neither economy is showing a straightforward boom.
For the U.S., the key issue is whether weak NFP Jobs numbers become a persistent pattern.
For Canada, the question is whether the recent employment gains can continue while unemployment declines and wage growth stabilizes.
What NFP Means for Inflation
NFP average hourly earnings are also closely watched because wage growth can influence inflation through labour costs and household demand.
The U.S. average hourly earnings increase of 3.2% over the year is not consistent with a sudden acceleration in wage pressures.
At the same time, wages remain positive, meaning workers continue to see nominal compensation growth.
The effect on inflation depends on several other factors, including productivity, consumer demand and prices for goods and services.
That is why wage growth should not be treated as a standalone inflation forecast.
Canada’s 2.8% wage-growth reading points to an even softer compensation trend in July.
For policymakers, that could provide some room to focus on economic growth and labour-market conditions rather than reacting to a renewed acceleration in wages.
But the unemployment rate remains an important constraint.
Canada’s unemployment rate at 6.4% is well above the U.S. rate of 4.1%.
That gap means the two central banks may face different labour-market conditions even if both economies are exposed to similar external risks.
Revisions Make the July NFP Jobs Report More Important
The revisions to earlier NFP Jobs data deserve particular attention.
Initial employment estimates are not final. Businesses report payroll information at different times, and seasonal adjustment factors are recalculated.
That process can produce meaningful changes.
In this case, May and June payroll growth was reduced by 103,000 combined.
The revision does not mean the earlier reports were necessarily wrong in a conventional sense. They were preliminary estimates based on the information available at the time.
But for investors looking at the current trend, the revised figures are now more relevant.
The result is a weaker recent employment trajectory than the original data suggested.
The July decline of 23,000 therefore arrives after two months that were themselves revised lower.
That combination makes the NFP Jobs report more consequential than the headline July number alone might imply.
The next employment reports will be important in determining whether July was an isolated weakness or part of a broader slowdown.
The BLS scheduled the August 2026 Employment Situation report for September 4, 2026.
There is also a preliminary benchmark revision scheduled for August 28, which could provide another important reference point for the underlying payroll series.
The BLS Benchmark Revision Could Matter
The annual benchmark process is an important but often overlooked part of the NFP Jobs story.
The establishment survey estimates are benchmarked against more comprehensive employment counts from the Quarterly Census of Employment and Wages.
The BLS report states that the preliminary estimate of the 2026 benchmark revision was scheduled for publication on August 28, 2026.
The final benchmark revision will be incorporated with the January 2027 Employment Situation report.
Benchmark revisions can change the historical interpretation of employment growth.
That means analysts should be cautious about drawing overly strong conclusions from a single monthly NFP Jobs figure.
The current data are important, but the historical series can still be adjusted as more complete information becomes available.
This is particularly relevant when the monthly changes are relatively small.
A decline of 23,000 jobs is meaningful as a headline, but the BLS notes that the establishment survey has a monthly confidence interval around the estimated employment change. The report also explains that preliminary estimates are subject to sampling and nonsampling error.
The broader trend is therefore more informative than any one monthly number.
What Businesses Should Watch Next
For businesses, the latest NFP Jobs data provide several signals.
First, employers may become more cautious about expanding payrolls if demand is uncertain.
Second, the sector mix matters. Health care remains a source of job creation, while retail and local government education declined.
Third, wage growth is still positive but does not appear to be accelerating sharply.
Fourth, revisions suggest that recent payroll growth was weaker than initially estimated.
For Canadian businesses, the picture is somewhat different.
The July employment increase is encouraging, particularly because it followed gains in May and June.
But the unemployment rate remains elevated, and wage growth has slowed.
Businesses may therefore continue to have access to a relatively large pool of potential workers even as employment expands.
Demographic trends complicate that assessment.
Retirements are reducing the available labour supply, while immigration restrictions have slowed population growth.
That could eventually create tighter labour-market conditions even if unemployment remains above historical norms.
The next stage of the cycle may therefore be determined by the balance between job creation and labour-force growth.
What Workers Should Take From the Data
For workers, the headline message is mixed.
U.S. workers face a labour market with limited payroll growth but a stable 4.1% unemployment rate.
The continuation of wage growth provides some support for household income, but the softer employment trend suggests that job seekers may face a more selective hiring environment.
Canadian workers have seen a stronger recent employment trend.
The 75,000 increase in July, combined with the decline in unemployment, indicates better labour-market conditions.
However, slower wage growth means that the improvement has not translated into stronger compensation growth.
Younger Canadian workers also continue to face higher unemployment than the broader population, with the youth unemployment rate at 12.6% in July.
That remains an important area to monitor.
The employment gains among young workers and the decline from a year earlier are positive, but the absolute unemployment rate remains high.
What Investors Should Watch in the Next Reports
The next U.S. employment reports will determine whether the July NFP Jobs weakness was temporary or part of a more persistent slowdown.
Several indicators deserve close attention.
Payroll growth
A return to consistent monthly employment gains would reduce concerns about a deeper labour-market slowdown.
Revisions
If previous months continue to be revised lower, the underlying trend could prove weaker than the headline numbers suggest.
Unemployment
A meaningful increase from 4.1% would represent a more significant deterioration than the July payroll decline alone.
Labour-force participation
A falling participation rate can complicate the interpretation of a stable unemployment rate.
Wage growth
The direction of NFP Earnings will remain important for inflation and monetary-policy expectations.
Hours worked
Changes in hours can provide an early indication of labour demand and economic activity.
For Canada, the key indicators are similarly broad.
Employment needs to remain positive, unemployment needs to continue falling and wage growth needs to stabilize.
If those three conditions occur together, the Canadian labour market could become materially healthier in the second half of 2026.

If employment growth fades while unemployment remains elevated, the July improvement may prove temporary.
The Bigger North American Labour-Market Picture
The latest employment figures suggest that the North American labour market is becoming more differentiated.
The U.S. is entering a period in which the headline NFP Jobs number is no longer enough to describe the labour market.
Payroll employment declined in July, revisions reduced the previous two months’ gains, and several major industries showed little change.
Yet unemployment remained at 4.1%, wages increased 3.2% over the year and health care continued to add workers.
That is a slowing labour market, but not necessarily a collapsing one.
Canada presents a different configuration.
Employment increased by 75,000, unemployment declined to 6.4% and total hours worked increased 0.6%.
But wage growth slowed to 2.8%, unemployment remains elevated and demographic pressures are changing the supply of available workers.
That is an improving labour market, but not an overheated one.
The distinction matters.
Both countries are navigating economic uncertainty, but their labour markets are responding differently.
For the U.S., the main issue is whether slower NFP Growth becomes entrenched.
For Canada, the main issue is whether recent employment gains can continue strongly enough to reduce unemployment while demographic constraints gradually limit labour supply.
NFP Jobs, Growth and Earnings: The Key Takeaways
The July employment data offer a relatively clear set of conclusions.
First, U.S. NFP Jobs weakened. Payroll employment declined by 23,000 in July.
Second, recent U.S. payroll growth was weaker than previously thought. May and June were revised down by a combined 103,000.
Third, U.S. unemployment remained stable. The unemployment rate held at 4.1%.
Fourth, U.S. wage growth remained positive. Average hourly earnings increased 3.2% over the year.
Fifth, U.S. employment growth was uneven by industry. Health care continued to expand, while local government education and retail employment declined.
Sixth, Canada produced stronger employment growth. The economy added 75,000 jobs in July.
Seventh, Canada’s unemployment rate improved. The rate fell to 6.4%, the lowest level in two years.
Eighth, Canada’s wage growth slowed. Wage growth eased to 2.8% from 3.3%.
Ninth, demographics are increasingly important in Canada. Slower population growth and elevated retirements are reducing the growth of the available labour supply.
Tenth, neither labour market can be summarized by one headline number. Payrolls, unemployment, participation, hours, wages, revisions and demographics all matter.
The most useful conclusion from the July data is therefore not that one economy is strong and the other is weak.
The evidence points instead to two labour markets moving through different stages of adjustment.
Frequently Asked Questions About NFP Jobs and Canada
What are NFP Jobs?
NFP Jobs refers to nonfarm payroll employment in the U.S. establishment survey. The measure tracks the number of employees on nonfarm payrolls across private businesses and government establishments. It excludes certain categories of workers, including agricultural workers and some self-employed workers.
What did the July 2026 NFP report show?
The July 2026 NFP report showed that U.S. nonfarm payroll employment declined by 23,000. The unemployment rate remained at 4.1%, while average hourly earnings increased 3.2% over the year.
Why were the NFP Jobs numbers revised?
NFP Jobs estimates are revised as additional information becomes available from businesses and government agencies. Seasonal factors can also be recalculated. The BLS routinely revises the prior two months of payroll data.
How much were May and June NFP Jobs revised?
May payroll growth was revised from an increase of 129,000 to 63,000. June was revised from an increase of 57,000 to 20,000. Combined, the revisions reduced reported employment growth by 103,000.
Did Canada add jobs in July 2026?
Yes. Based on the Canadian labour-market figures supplied for this analysis, Canada added approximately 75,000 jobs in July, following increases in May and June.
What was Canada’s unemployment rate in July?
Canada’s unemployment rate declined to 6.4% in July, according to the data supplied. That was the lowest rate in two years and below the 6.9% high recorded in April.
What happened to Canadian wage growth?
Canadian wage growth slowed to 2.8% in July from 3.3% in June. The moderation in wage growth suggests that the improving employment market has not yet produced stronger compensation pressure.
Which country had stronger job growth in July?
Canada recorded stronger headline employment growth in July, adding approximately 75,000 jobs, while U.S. nonfarm payroll employment declined by 23,000. However, the figures are based on different statistical systems and should not be treated as a direct one-for-one comparison.
Why can U.S. NFP Jobs fall while unemployment stays unchanged?
The payroll survey and household survey measure employment differently. The unemployment rate can remain stable when employment, unemployment and labour-force participation change at the same time. The July U.S. household survey showed a decline in the labour force alongside relatively stable unemployment.
What does NFP Earnings mean?
NFP Earnings generally refers to wage and earnings information released with the U.S. employment report. Average hourly earnings are closely watched because changes in compensation can influence household income, consumer demand and inflation pressures.
Are NFP Jobs a reliable measure of the U.S. labour market?
NFP Jobs are one of the most closely followed U.S. employment indicators, but they are not the only measure. The unemployment rate, labour-force participation, household employment, hours worked, wages and revisions provide additional information.
What should investors watch after the July report?
Investors should watch the next payroll reports, revisions to recent data, unemployment, labour-force participation, wage growth, hours worked and industry-level employment. These indicators will help determine whether July represented a temporary slowdown or a broader change in the U.S. labour market.
Conclusion: A Softer U.S. Labour Market Meets a Firmer Canada
The July employment data provide a more nuanced picture of North American labour markets than the headline numbers alone suggest.
U.S. NFP Jobs declined by 23,000 in July, while revisions reduced payroll growth in May and June by a combined 103,000. The unemployment rate nevertheless remained at 4.1%, and average hourly earnings increased 3.2% over the year.
That points to a U.S. labour market that is losing momentum without showing the broad deterioration that would normally accompany a much sharper economic downturn.
Canada’s labour market moved in the other direction.
Employment rose by 75,000 in July, the unemployment rate fell to 6.4% and total hours worked increased. The improvement was broad enough to suggest that labour-market conditions have strengthened from the softer start to 2026.
But the Canadian economy still faces constraints.
Unemployment remains elevated, wage growth slowed to 2.8%, and demographic trends are changing the supply of available workers. Retirements and slower population growth could make labour supply increasingly important in the months ahead.
The result is a North American employment picture defined by divergence.
The U.S. is showing slower NFP Growth and softer recent payroll momentum, while Canada is showing stronger employment growth but remains further from a fully tight labour market.
For investors, businesses and policymakers, the next reports will matter more than any single July headline.
The direction of payroll revisions, unemployment, wages, hours and labour-force participation will determine whether the latest numbers represent a temporary adjustment or the beginning of a more sustained shift.
For now, the evidence supports a measured conclusion: U.S. NFP Jobs are cooling, while Canada’s labour market is improving, but neither economy provides a simple picture of strength or weakness.