








The September 2026 NFP report recorded modest payroll growth, an unemployment rate of 4.2% and annual wage growth of 3%, while revisions reduced the combined job gains reported for July and August.
Table of Contents
- Introduction: A Slower Pace of US Job Growth
- September NFP at a Glance
- What the September NFP Number Reveals
- Revisions Change the Recent Employment Picture
- Industry Breakdown: Where Jobs Were Added and Lost
- Health Care Adds Jobs, but Growth Is Below Its Recent Average
- Construction Records Another Monthly Increase
- Manufacturing Adds 9,000 Jobs
- Financial Activities Reports a Decline
- Information Employment Declines
- Professional and Business Services Lose Jobs
- Government Employment Falls
- Retail, Transportation and Leisure Add Jobs
- Unemployment Holds at 4.2%
- Labor Force Participation and Employment Measures
- Long-Term Unemployment Remains an Important Measure
- Part-Time Employment for Economic Reasons
- Wage Growth: Average Hourly Earnings Reach $37.81
- The Average Workweek Is Unchanged
- Demographic Differences in Unemployment
- Why the Two Employment Surveys Can Tell Different Stories
- Understanding Statistical Significance in the September Report
- What the September Report May Mean for Businesses
- What Investors May Watch After the NFP Release
- How to Read the NFP Report Without Overstating Its Message
- The Outlook: What to Monitor in the Next Employment Reports
- Conclusion: Modest Payroll Growth and Uneven Employment Conditions
- Frequently Asked Questions About the September 2026 NFP Report
- What was the US NFP number for September 2026?
- What was the unemployment rate in September 2026?
- Did US employment grow or decline in September?
- Which industries added the most jobs in September 2026?
- Which industries lost jobs in September 2026?
- How much did wages increase in September 2026?
- Why were the July and August payroll figures revised?
- Was the September 2026 NFP result statistically significant?
- What is the difference between NFP and the unemployment rate?
- When will the next US jobs report be released?
Introduction: A Slower Pace of US Job Growth
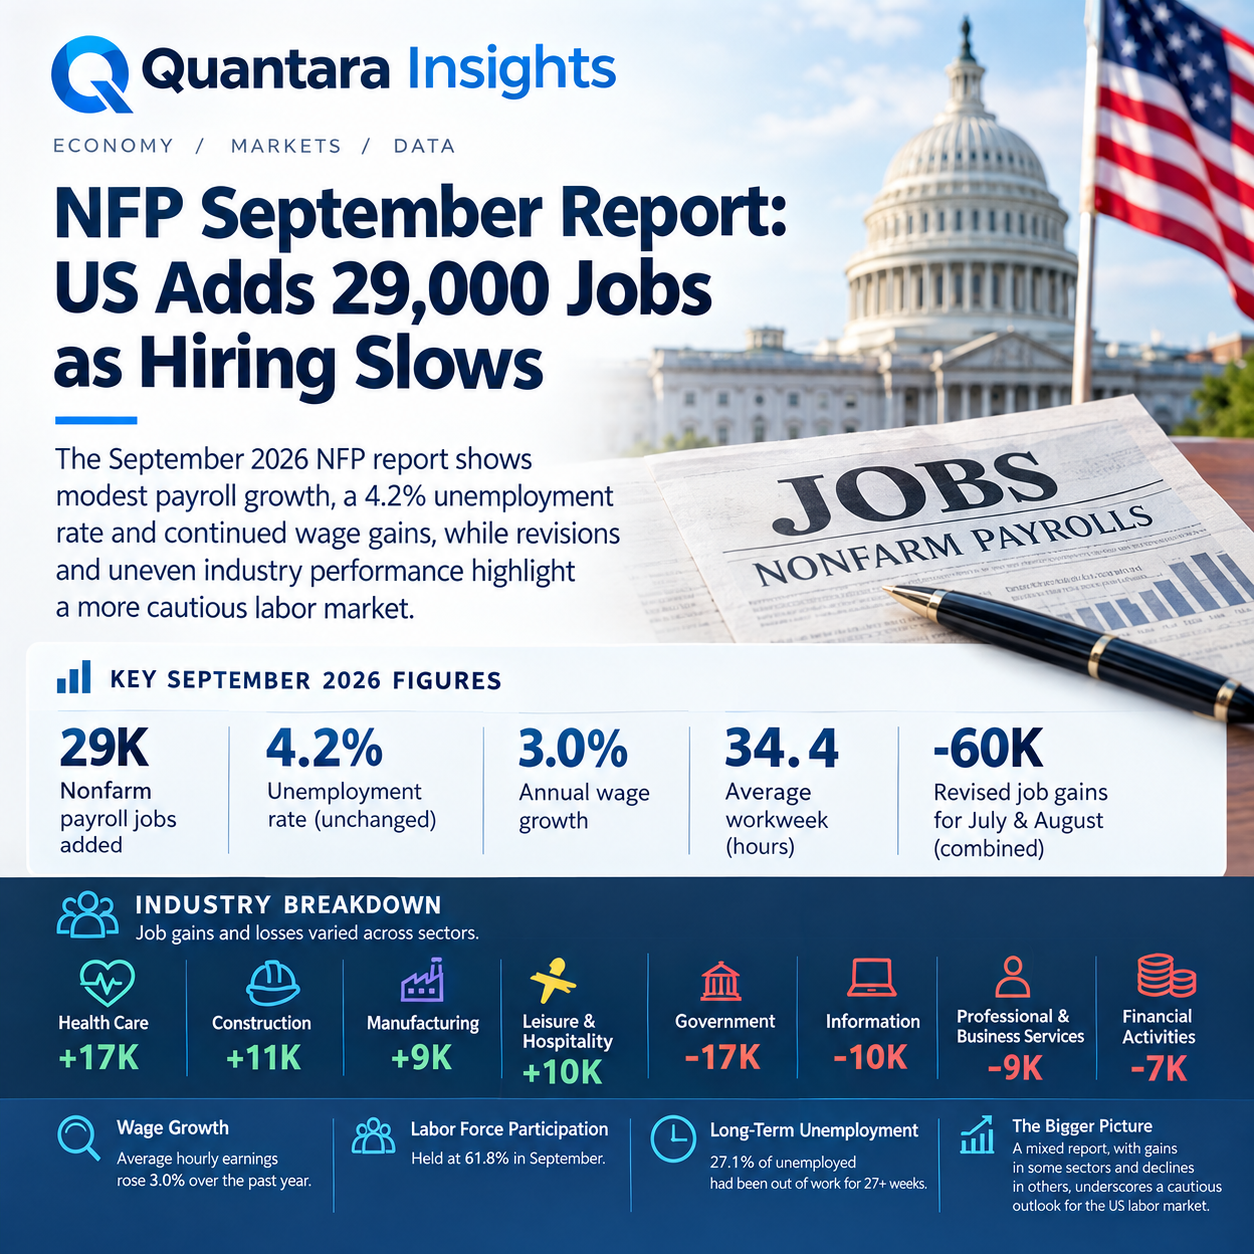
The September 2026 NFP report points to a US labor market that is continuing to add jobs, but at a measured pace. Employers added 29,000 nonfarm payroll jobs during the month, while the unemployment rate stood at 4.2%. Average hourly earnings increased by 0.1% over the month and were 3.0% higher than a year earlier.
The headline figures tell only part of the story. Revisions to the previous two months reduced reported payroll growth by a combined 60,000 jobs. Health care and construction recorded gains, while several other industries, including information, professional and business services, and government, reported declines.
The report also shows why a single monthly employment figure should not be treated as a complete measure of labor-market conditions. The establishment survey measures payroll jobs, while the household survey measures people’s employment status. They cover different concepts and can produce different signals. In addition, the Bureau of Labor Statistics notes that the September payroll change was not statistically significant on its own.
For investors, business leaders, policymakers and analysts, the latest NFP data offers a detailed snapshot rather than a definitive verdict. The figures raise questions about the breadth of hiring, the durability of wage growth, the distribution of employment gains and the extent to which recent weakness reflects a temporary pause or a more persistent change in labor demand.
This analysis examines the September results, the industries behind the headline number, the household employment indicators and the statistical limitations that matter when interpreting the report.
September NFP at a Glance
The central findings from the September 2026 employment report are:
- Nonfarm payrolls: Increased by 29,000.
- Unemployment rate: Held at 4.2%.
- Average hourly earnings: Rose by 5 cents, or 0.1%, to $37.81.
- Annual wage growth: Average hourly earnings increased 3.0% over 12 months.
- Average workweek: Remained unchanged at 34.4 hours.
- Previous-month revisions: July and August payroll estimates were revised down by a combined 60,000.
- Health care: Added 17,000 jobs.
- Construction: Added 11,000 jobs.
- Manufacturing: Added 9,000 jobs.
- Government: Lost 17,000 jobs.
- Information: Lost 10,000 jobs.
- Professional and business services: Lost 9,000 jobs.
These figures describe different parts of the employment picture. Payroll growth measures changes in jobs reported by employers. The unemployment rate reflects the share of the civilian labor force that is unemployed and actively seeking work. Earnings data provide information about hourly pay, while the average workweek helps indicate how much labor employers are using.
Taken together, the September results show positive but limited payroll growth alongside continued wage increases and a range of industry-specific outcomes. They do not, by themselves, establish the direction of the economy over the coming months.
What the September NFP Number Reveals
The addition of 29,000 jobs represents a relatively small monthly increase in nonfarm payroll employment. The report states that the average monthly payroll gain over the preceding 12 months was 45,000. September’s increase was therefore below that recent average.
A comparison with the prior-year trend is useful, but it needs context. Monthly payroll figures fluctuate, and the amount of variation can be substantial relative to a modest reported change. A single month below the recent average does not necessarily indicate that employers have entered a sustained period of contraction.
The statistical properties of the establishment survey are particularly important in this case. The BLS estimates that the threshold for statistical significance in the monthly payroll change is approximately plus or minus 122,000 jobs. The September increase of 29,000 falls well within that range. In practical terms, the monthly estimate alone does not provide strong statistical evidence that payroll employment rose by a precisely measured amount.
That does not make the figure irrelevant. It remains part of the monthly employment record and can be assessed alongside revisions, industry-level changes, household survey results and subsequent reports. It does mean that conclusions should be proportionate to the precision of the estimate.
The difference between a reported number and a statistically clear change is an essential distinction. A headline increase of 29,000 is the published estimate. It should not be described as proof that the underlying labor market added exactly 29,000 jobs or that hiring conditions changed decisively during September.
For readers following the NFP report, the more useful question is not simply whether the headline was positive or negative. It is how the figure fits into a wider pattern. That requires looking at the previous months, the industries contributing to growth, the industries losing jobs and the household measures that capture employment from a different perspective.
Revisions Change the Recent Employment Picture
The September report included notable revisions to earlier payroll estimates. August’s reported increase was revised from 162,000 to 133,000. July was revised from a gain of 21,000 to a decline of 10,000.
Together, those changes reduced the combined payroll total for July and August by 60,000 jobs.
Revisions are a routine feature of the monthly employment data. The initial payroll estimate is based on the information available when the report is prepared. As additional employer responses arrive and seasonal factors or other estimation inputs are updated, the BLS can revise earlier figures.
The revisions matter because they affect how the recent path of employment is understood. Before the adjustments, July and August appeared to show a combined increase of 183,000 jobs. After the revisions, the combined change was 123,000. The direction remained positive across the two months as a whole, but the pace was lower than initially reported.
The adjustment to July is especially relevant because it changed the month from a reported gain to a reported loss. That does not mean the initial estimate was improper. It illustrates the uncertainty that accompanies preliminary monthly estimates and the value of reviewing the data as a series rather than treating each release as final.

For businesses, analysts and market participants, revisions can influence the interpretation of labor demand. A strong initial payroll number followed by a substantial downward revision may suggest that the first estimate overstated the pace of hiring. Conversely, upward revisions can strengthen the picture of employment growth.
The September revisions reinforce the need to track multiple releases. They also show why a news analysis should report both the latest monthly change and the revised history. Looking only at the new headline can obscure changes to the baseline against which it is being compared.
In this report, the combination of modest September growth and lower prior estimates creates a more restrained picture of recent payroll momentum than the unrevised figures would have suggested. It remains an interpretation of the reported series, not proof of a particular economic outcome.
Industry Breakdown: Where Jobs Were Added and Lost
The aggregate payroll figure combines industries with different hiring patterns. September’s results were mixed, with gains in health care, construction and manufacturing offset by declines in government, information and professional and business services.
That distribution is important. Employment growth concentrated in a few industries can produce a positive national total even when other parts of the economy are reducing headcount. Similarly, losses in several sectors can coexist with continued hiring elsewhere.
Health Care Adds Jobs, but Growth Is Below Its Recent Average
Health care added 17,000 jobs in September. That was a positive contribution to the overall payroll figure, but it was below the industry’s average monthly gain of 33,000 over the preceding 12 months.
Within health care, ambulatory health care services added 13,000 jobs and hospitals added 12,000. Nursing and residential care facilities, by contrast, lost 9,000 jobs.
These subindustry figures show why broad sector labels can hide important differences. Employment in hospitals and ambulatory services increased, while nursing and residential care employment declined. The combined health-care result reflects those contrasting movements.
Health care has been a significant source of employment growth in the recent data. September’s increase continued that pattern, but the smaller gain relative to the previous 12-month average suggests that the pace was more moderate during the month.
It would be premature to infer a lasting shift from one release. Monthly employment changes can vary, and the report does not establish why the subindustries moved in different directions. Staffing needs, business conditions, labor availability and other factors may be relevant areas for further analysis, but the payroll figures alone do not identify a single cause.
For employment analysis, the key distinction is between continued growth and the speed of that growth. Health care continued to add jobs in September. It did so at a slower pace than its recent average, with the gains concentrated in particular areas of the industry.
Construction Records Another Monthly Increase
Construction added 11,000 jobs in September, close to its average monthly increase of 10,000 over the preceding 12 months.
Nonresidential specialty trade contractors contributed 12,000 jobs to the September increase. This subindustry’s gain was slightly larger than the overall construction increase, indicating that other construction segments collectively offset part of the addition.
The result suggests that construction employment remained relatively steady in comparison with its recent pattern. Unlike industries with a sharp departure from their preceding averages, construction’s September payroll change was broadly consistent with the pace recorded over the prior year.
However, payroll data do not provide a complete account of construction activity. Job counts measure employment, not the value of projects, the number of permits, construction spending or the volume of work completed. A stable employment figure can coexist with changes in productivity, project mix or hours worked.
The unchanged national average workweek of 34.4 hours also offers limited context. It indicates that the average workweek across private nonfarm employment did not change, but it does not reveal whether construction workers specifically worked more or fewer hours.
For readers assessing the construction sector, September’s report provides evidence of continued hiring, particularly among nonresidential specialty trade contractors. Additional industry and business data would be needed to evaluate the broader outlook.
Manufacturing Adds 9,000 Jobs
Manufacturing employment increased by 9,000 in September. The report also notes that manufacturing employment had risen by 72,000 since its recent low in December 2025.
Plastics and rubber products manufacturing added 5,000 jobs, while machinery manufacturing also added 5,000. The gains in those two areas were larger than the overall manufacturing increase, meaning that other manufacturing industries collectively offset part of their contribution.
The change is relevant because manufacturing employment can reflect conditions across a broad range of businesses, from industrial equipment and machinery to materials and consumer products. Yet the sector is not uniform. Demand, production processes and staffing requirements can differ significantly between subsectors.
The increase since December 2025 provides a longer reference period than the monthly change alone. It indicates that the sector’s employment level had recovered from its recent low by September. It does not establish that all manufacturing industries experienced similar gains or that output increased by the same proportion.
Employment and production are related but distinct measures. Employers can change staffing levels in response to expected demand, productivity, inventory needs and operational decisions. A payroll increase is therefore one indicator of manufacturing conditions, not a direct measure of industrial output.
The September figures show that manufacturing contributed to job growth, with reported gains in plastics and rubber products and machinery. The broader direction of the sector should be assessed using several months of employment data alongside production, orders and other relevant indicators.
Financial Activities Reports a Decline
Financial activities lost 7,000 jobs in September. The report states that employment in the sector had declined by 129,000 since its peak in May 2025.
Insurance carriers and related activities accounted for a substantial portion of that longer-term decline, with employment down 90,000 since the sector’s peak.
The distinction between the monthly and longer-term figures matters. The September loss of 7,000 is a measure of the change during one month. The 129,000 decline describes the cumulative movement since May 2025. The two figures answer different questions and should not be treated as interchangeable.
Financial activities includes a range of businesses with different operating models and labor needs. Changes in employment may reflect restructuring, shifts in business activity, technological changes or other company-specific and industry-wide factors. The report documents the employment change but does not assign a definitive cause.
The concentration of the longer-term decline in insurance carriers and related activities is a useful detail for sector analysis. It indicates that the broader financial-activities reduction has not been evenly distributed across all components.
For employers and workers in financial services, payroll trends can provide a signal about staffing conditions. However, employment totals alone cannot show whether job losses were concentrated in particular occupations, locations or levels of seniority. Those questions require more detailed data.
September’s financial-activities result adds to the evidence of uneven employment performance across the US economy. It is one of several sector declines that offset gains elsewhere in the labor market.
Information Employment Declines
The information industry lost 10,000 jobs in September. The result contributed to the difference between growth in some service industries and reductions in others.
The information category covers a broad collection of activities. A monthly industry total does not reveal the precise mix of company decisions or occupational changes behind the decline. It also does not establish whether the loss was concentrated in a small number of businesses or distributed more widely.
The reported decline should therefore be interpreted narrowly: information employment was lower in September than in August according to the published estimate. Determining whether that movement reflects a sustained trend requires additional monthly observations and, where available, more detailed industry information.
In a labor market where overall payroll growth is modest, declines of this size can have a visible effect on the national total. The information sector’s result is one example of how individual industries can influence the headline number even as other sectors continue hiring.
Professional and Business Services Lose Jobs
Professional and business services employment declined by 9,000 in September. Temporary help services lost 10,900 jobs.
The temporary-help figure is larger than the overall decline in professional and business services. That means other parts of the broad sector collectively offset some of the temporary-help reduction.
Temporary-help employment can be useful to monitor because staffing firms provide workers to businesses across different industries. Changes in this category may reflect adjustments in flexible staffing demand, but the report does not establish that temporary-help employment predicts future hiring in any particular month.
The September figures show a decline in the temporary-help category alongside a smaller net decline for the broader professional and business services sector. This distinction is important when interpreting the data. A broad industry total may conceal larger movements in individual components.
The result adds to the mixed pattern across industries. While health care, construction and manufacturing added jobs, professional and business services recorded a decline. The data point to different employment conditions across sectors rather than a uniform national hiring pattern.
Government Employment Falls
Government employment declined by 17,000 in September. This was the largest reported sector decline among the industries highlighted in the report.
Government employment can be affected by public-sector staffing decisions at different levels of government. The aggregate figure does not, on its own, identify the precise policy, budgetary or operational factors behind the monthly change.
The distinction between public- and private-sector employment also matters when interpreting the total nonfarm payroll number. Nonfarm payrolls include government employment as well as private employment. A decline in government payrolls can therefore reduce the headline total even if private employers are adding jobs.
September’s overall payroll increase of 29,000 occurred alongside the government decline of 17,000. That means gains in the other included sectors collectively exceeded the national net increase by an amount equivalent to the government loss and other offsetting movements.
The report provides the employment outcome, not a full explanation of the decisions behind it. Further analysis would be needed to identify whether the decline was concentrated in federal, state or local government employment and what drove the change.
Retail, Transportation and Leisure Add Jobs
Several other industries recorded gains in September.
Retail trade added 5,800 jobs. Transportation and warehousing added 7,600, while leisure and hospitality employment increased by 10,000.
These increases contributed to the positive national payroll total. Their individual sizes were relatively modest, but they illustrate the range of industries where employment expanded during the month.

Retail and transportation employment can reflect different patterns in business operations, distribution and consumer-facing activity. Leisure and hospitality includes businesses whose staffing needs can vary with customer demand and operating schedules. The payroll figures show employment changes, but they do not directly measure sales, passenger volumes, spending or service output.
The combination of gains and losses across these industries reinforces a central feature of the September report: the labor market did not move in one direction across every sector. Some industries expanded their payrolls, while others reduced employment.
A broader assessment should consider whether these movements persist, whether gains become more widespread and how the distribution of employment changes compares with earlier months.
Unemployment Holds at 4.2%
The unemployment rate remained at 4.2% in September. The household survey estimated that 7.109 million people were unemployed.
The unemployment rate is calculated using the civilian labor force as its base. It represents the share of people in that labor force who are unemployed and actively seeking work. It is not the share of the entire population without a job.
That distinction is important because people who are not working may be outside the labor force for many reasons. Some are retired, studying, caring for family members or unable to work. Others may want a job but not meet the survey’s criteria for being counted as unemployed.
The September unemployment rate provides a stable headline measure relative to August, but it should be read alongside other household survey indicators. Participation, the employment-population ratio, long-term unemployment and involuntary part-time work offer additional information about labor-market conditions.
A rate that remains unchanged does not mean that no individuals entered or left employment or unemployment during the month. The measure is an aggregate ratio. People can move between employment, unemployment and nonparticipation while the overall rate remains the same.
The unemployment count and rate also measure different things. The count estimates the number of unemployed people; the rate expresses that number relative to the labor force. Both are useful, but neither fully captures job quality, hours, pay or the ease with which people can find work.
For that reason, the unchanged 4.2% rate should be viewed as one component of the September employment picture. It does not negate the modest payroll increase, nor does it resolve questions raised by the revisions and industry-level declines.
Labor Force Participation and Employment Measures
The labor force participation rate was 61.8% in September, while the employment-population ratio stood at 59.2%.
These indicators help distinguish between employment conditions and participation in the labor market.
The participation rate measures the share of the civilian noninstitutional population that is either employed or unemployed and actively seeking work. The employment-population ratio measures the share of that population that is employed.
The two figures can move differently. For example, if people stop looking for work, they may leave the labor force. That movement can affect the unemployment rate even if the number of employed people does not increase. Conversely, an increase in participation can add people to the labor force, including people who are looking for work.
The September participation rate of 61.8% and employment-population ratio of 59.2% provide context for the 4.2% unemployment rate. They help analysts evaluate how much of the population is connected to employment or actively seeking it.
However, a single month’s rates do not reveal all the reasons behind participation decisions. Age distribution, education, caregiving responsibilities, retirement patterns, health, local opportunities and other factors can influence labor-force attachment. The report’s headline indicators do not isolate the contribution of each factor.
The figures are most informative when compared over time and considered alongside demographic and employment details. A stable unemployment rate combined with changing participation can produce a different interpretation from a stable unemployment rate accompanied by rising participation.
September’s figures should therefore be treated as a set of related indicators rather than separate verdicts on the labor market.
Long-Term Unemployment Remains an Important Measure
The number of people unemployed for 27 weeks or longer was 1.944 million in September. They accounted for 27.1% of all unemployed people.
Long-term unemployment matters because the duration of joblessness can affect a person’s financial position, work experience and prospects for returning to employment. It can also provide information about whether unemployed workers are finding jobs relatively quickly or remaining without work for extended periods.
The 27.1% share indicates that more than one-quarter of unemployed people had been looking for work for at least 27 weeks, according to the household survey measure. It is a different indicator from the overall unemployment rate, which does not distinguish between short and long spells.
A labor market can have a relatively stable unemployment rate while still experiencing challenges among people who have been unemployed for a long time. The overall rate aggregates people with very different experiences. Long-term unemployment adds a duration dimension to the analysis.
The September report also estimated that 5.790 million people outside the labor force wanted a job. This group is not counted as unemployed under the standard definition unless its members meet the relevant criteria for recent job search and availability.
The distinction is important when assessing unmet demand for work. The unemployed population includes people actively searching for jobs, while people outside the labor force who want work represent a separate group with varying levels of labor-market attachment.
The report estimated 1.468 million marginally attached people, a decline of 236,000. Marginally attached individuals wanted and were available for work and had searched for a job within the previous 12 months, but not during the four weeks preceding the survey.
Discouraged workers, a subset of the marginally attached, totaled 414,000. These individuals were not currently searching because they believed no jobs were available for them or that there were no jobs for which they would qualify.
These measures broaden the analysis beyond the headline unemployment rate. They do not replace it, but they help describe people who want employment and may face barriers or have become less actively connected to the job-search process.
Part-Time Employment for Economic Reasons
The household survey estimated that 4.501 million people were working part time for economic reasons in September.
This category includes people who would prefer full-time employment but were working part time because of economic conditions, such as reduced hours or an inability to find full-time work.
The measure is relevant because employment status alone does not show whether people are getting the amount of work they want. Someone working part time is counted as employed, even if they would prefer a full-time schedule.
That does not mean all part-time employment is involuntary or economically distressing. Many people choose part-time work for personal, educational, caregiving or other reasons. The economic-reasons category is designed to distinguish people whose part-time schedules reflect labor-market constraints.
The September total provides a measure of that group’s size. It should be considered alongside the unemployment count, the number of people who want a job but are outside the labor force, and the average workweek.
The average workweek for all private nonfarm employees was unchanged at 34.4 hours in September. That aggregate figure does not show how hours changed for every worker or industry, but it provides another measure of labor utilization.
Together, these indicators help answer a broader question than whether people have jobs. They provide information about whether available employment is meeting workers’ desired hours and whether businesses are using labor more or less intensively.
Wage Growth: Average Hourly Earnings Reach $37.81
Average hourly earnings for private nonfarm employees increased by 5 cents in September, or 0.1%, to $37.81. Over the preceding 12 months, average hourly earnings rose by 3.0%.
For production and nonsupervisory employees, average hourly earnings were $32.60, an increase of 0.2% during the month.
Wage growth is a central part of employment analysis because it provides information about labor costs and workers’ nominal earnings. However, average hourly earnings are not the same as total compensation, household income or purchasing power.
The monthly increase of 0.1% indicates that the average hourly earnings measure rose slightly between August and September. The 3.0% annual increase compares the September 2026 level with the level 12 months earlier.
Whether wage growth translates into an increase in real purchasing power depends on price changes over the same period. The employment report’s wage figures do not, by themselves, establish the change in inflation-adjusted earnings. That assessment requires a compatible measure of consumer prices.
Average earnings can also change because of the composition of employment. If the mix of workers or industries shifts, the overall average may rise or fall even when individual workers’ pay rates do not change by the same amount.
For example, a change in the share of employment in higher-paying or lower-paying industries can influence the aggregate average. The same applies to shifts in occupations, hours or workforce composition. The reported average is therefore a useful broad indicator, but it is not a direct measure of the pay increase received by every worker.
The September wage figures show continued nominal earnings growth. The monthly gain was limited, while the annual increase was 3.0%. Further interpretation requires comparing wages with inflation and examining other compensation measures.
The Average Workweek Is Unchanged
The average workweek for private nonfarm employees remained at 34.4 hours in September.
Hours worked provide information that payroll counts cannot capture. Employers may adjust the amount of labor they use by changing schedules or overtime before making changes to headcount. Conversely, employment can rise while average hours remain stable.
An unchanged average workweek indicates that the national measure did not change from August to September. It does not mean every worker worked the same number of hours or that hours were unchanged in every industry.
The average also combines full-time and part-time employees, different occupations and industries. Changes in the composition of the workforce can influence the aggregate measure.
When viewed alongside payroll growth, hours data can help analysts distinguish between changes in the number of jobs and changes in labor utilization. September’s combination of modest payroll growth and an unchanged average workweek offers no evidence of a broad monthly shift in this particular aggregate hours measure.
The data should not be extended beyond what they show. They do not establish whether employers are planning to increase or reduce hours in the future, nor do they identify the causes of any company-level scheduling decisions.
Demographic Differences in Unemployment
The September report showed different unemployment rates across demographic groups.
- Adult men: 3.9%
- Adult women: 3.6%
- Teenagers: 14.5%
- White workers: 3.6%
- Black workers: 7.0%
- Asian workers: 2.9%
- Hispanic workers: 4.7%
The report noted that the unemployment rate for Black workers increased by 1 percentage point. These figures show that the national unemployment rate of 4.2% does not describe the experience of every demographic group.
The differences should be interpreted with care. The groups have different population sizes and demographic compositions, and their labor-market experiences can vary across industries, occupations, locations and age ranges. The unemployment rates do not identify the causes of the differences.
Teenagers, for example, have a substantially higher unemployment rate than the national figure. Their labor-market participation and employment patterns differ from those of adults, including because many are in education or entering the workforce for the first time. The teenage unemployment rate should not be interpreted as directly comparable in every respect to the rate for prime-age adults.
The reported rates for racial and ethnic groups are also descriptive measures. They provide information about unemployment outcomes in the survey population but do not, on their own, explain the factors behind those outcomes. Differences in industry exposure, geography, education, job tenure, hiring practices and other conditions may be relevant topics for further investigation.
The increase in the Black unemployment rate is a notable monthly change in the report. A full assessment would examine the movement over several months, the size and uncertainty of the estimate, and related measures such as participation and employment-population ratios.
For employers and policymakers, demographic data can help identify where aggregate indicators may conceal uneven conditions. For readers, the central point is that national averages are useful summaries, but they do not represent every worker’s experience.
Why the Two Employment Surveys Can Tell Different Stories
The monthly Employment Situation report combines information from two major surveys: the establishment survey and the household survey.
The establishment survey, also known as the Current Employment Statistics survey, collects information from businesses and government agencies about payroll employment, hours and earnings. The household survey, formally the Current Population Survey, asks households about the labor-force status of individuals.
Because the surveys measure different concepts, their results are not expected to match exactly.
The establishment survey counts payroll jobs. A person with two payroll jobs can be counted twice. The household survey counts people and classifies each person according to employment status. It can include categories of workers and employment arrangements that are not represented in the establishment survey in the same way.
The surveys also use different samples and estimation methods. Their monthly estimates can therefore move differently, especially when changes are modest or when the underlying conditions vary across groups.
The distinction matters for interpreting the September report. The 29,000 increase in nonfarm payrolls comes from the establishment survey. The 4.2% unemployment rate, the participation rate and the employment-population ratio come from the household survey.
It would be inaccurate to treat these measures as if they were different calculations of the same statistic. They answer related but distinct questions.
The establishment survey is useful for tracking changes in payroll employment by industry, along with hours and earnings. The household survey is essential for understanding unemployment, labor-force participation and the number of people employed.
Both are valuable. Neither should be used as a substitute for the other when the question concerns a measure that only one survey is designed to provide.
Understanding Statistical Significance in the September Report
The statistical uncertainty around monthly payroll estimates is especially important when the reported change is small.
The BLS indicates that the monthly change in establishment-survey employment generally needs to be around 122,000 jobs in either direction to be statistically significant at the stated threshold. September’s estimated increase of 29,000 was considerably smaller.
This does not mean that the actual change was necessarily zero. It means the estimate is not sufficiently precise, by itself, to distinguish the observed change from sampling variability at that threshold.
Statistical significance is not the same as economic importance. A change can matter to workers, employers or a particular industry even if it is not statistically significant in the national estimate. Equally, a statistically significant change does not automatically explain what caused it or what will happen next.
The distinction is particularly relevant when interpreting modest payroll movements. Describing September as a month in which the labor market definitively added exactly 29,000 jobs would overstate the precision of the estimate. Describing the figure as a published estimate of a 29,000 increase is accurate.
The report’s revisions provide another reason to avoid overinterpreting preliminary data. July and August were revised by a combined 60,000 jobs. Those changes demonstrate that the estimates can evolve as more information becomes available.
A sound reading of the NFP report should therefore consider the initial estimate, the uncertainty around it, the revisions to prior months and the direction of related indicators. This approach does not eliminate uncertainty, but it makes the analysis more transparent.
What the September Report May Mean for Businesses
For business leaders, employment data can inform decisions about hiring, staffing, labor costs and operating plans. The September figures offer several areas to monitor, although they do not dictate a single business response.
First, payroll growth was below the preceding 12-month average. Businesses evaluating demand and staffing needs may consider whether the slower increase is part of a continuing pattern or a temporary monthly fluctuation.
Second, industry results differed considerably. Health care, construction and manufacturing added jobs, while government, information and professional and business services reported declines. Companies should be cautious about applying national employment trends directly to their own sector or local market.
Third, annual average hourly earnings growth was 3.0%. Employers may consider that figure alongside their own wage data, recruitment conditions, productivity and other labor-cost measures. The national average does not establish the pay pressure faced by a particular employer or occupation.
Fourth, the average workweek was unchanged. Businesses may want to track both hours and headcount because adjustments to schedules can affect labor utilization without producing an immediate change in employment totals.
Finally, revisions and statistical uncertainty matter for planning. A single payroll estimate should not be treated as a precise forecast of demand or a direct measure of a company’s future hiring environment.
For organizations with substantial exposure to a particular industry, more detailed employment data may be more informative than the national headline. The September report is a useful starting point, but business decisions generally require additional information about sales, orders, customer demand, financing, workforce availability and local conditions.
What Investors May Watch After the NFP Release
Investors often examine employment reports for information about economic activity, labor costs and the possible direction of monetary policy. The September NFP data provides several indicators relevant to that assessment, but the report alone cannot determine market outcomes or future policy decisions.
The 29,000 payroll increase is one data point in the broader employment series. Its modest size and statistical uncertainty make it important to compare with subsequent reports and revised estimates.
Wage growth is another area to monitor. Average hourly earnings increased 3.0% over 12 months. To assess the implications for inflation and corporate costs, investors would need to consider consumer-price data, productivity, total compensation and the distribution of wage changes.
Industry performance can also matter. Employment gains in health care, construction and manufacturing occurred alongside declines in several service and public-sector categories. Investors following particular companies or industries may find the detailed sector data more relevant than the aggregate payroll change.

The household survey provides a separate set of signals. The unemployment rate remained at 4.2%, while participation was 61.8% and the employment-population ratio was 59.2%. These measures help describe the relationship between employment, unemployment and labor-force participation.
However, financial markets respond to a wide range of information, including inflation, central-bank communications, earnings, fiscal developments and international events. It would be too strong to attribute any market movement or policy expectation to the September employment report alone without additional evidence.
The practical approach is to treat NFP as one input in a wider analytical process. Its value comes from combining the headline number with the details and then comparing the report with other economic information.
How to Read the NFP Report Without Overstating Its Message
Employment releases attract attention because they condense a large amount of information into a few headline figures. That simplicity can also create a risk: the most visible number may be treated as a complete account of labor-market conditions.
Several principles can help readers interpret the September report more carefully.
Look at the trend, not only the monthly change. September’s payroll increase was 29,000, compared with a preceding 12-month average of 45,000. The difference is informative, but the broader series is more useful than a single observation.
Check revisions. The combined July and August payroll estimates were revised down by 60,000. Earlier figures are part of the current picture and should be reviewed when assessing momentum.
Examine industry contributions. Health care, construction and manufacturing added jobs, while several other sectors lost employment. A positive national total does not mean every industry is expanding.
Separate jobs from people. Payroll employment counts jobs, while the household survey counts people. The two measures are related but are not identical.
Consider participation and underemployment measures. The unemployment rate does not capture every person who wants work or every worker who wants additional hours. Participation, long-term unemployment and part-time work for economic reasons add context.
Distinguish nominal wage growth from real earnings. A 3.0% increase in average hourly earnings over 12 months is a nominal measure. Assessing purchasing power requires comparison with inflation.
Respect statistical uncertainty. The 29,000 payroll estimate was not statistically significant on its own under the report’s stated threshold. That caveat should be reflected in descriptions of the result.
Avoid treating the report as a forecast. The data describe recent employment conditions. They do not establish what employers will do in the next month or quarter.
These principles help maintain a clear distinction between what the report measures and what an analyst may infer from it.
The Outlook: What to Monitor in the Next Employment Reports
The September employment report leaves several questions open. The next releases will help establish whether the modest payroll increase is part of a broader pattern and whether the industry-level movements persist.
One issue is the pace of payroll growth. September’s increase was below the preceding 12-month average, but it was also small relative to the establishment survey’s statistical uncertainty. Additional months will provide more information about the direction of employment.
A second issue is the distribution of hiring. Health care, construction and manufacturing recorded gains, while information, professional and business services, financial activities and government reported declines. Future data will show whether these differences continue or whether employment gains and losses become more broadly distributed.
A third area is the relationship between wages and prices. Annual average hourly earnings growth was 3.0%. Inflation data will be necessary to evaluate changes in real earnings and to place nominal wage growth in a wider economic context.
A fourth consideration is the household labor-force picture. The unemployment rate remained at 4.2%, but the report also recorded long-term unemployment, people outside the labor force who wanted a job and people working part time for economic reasons. Changes in these indicators can provide additional evidence about the availability and use of labor.
Finally, revisions will remain important. The latest report revised July and August downward by a combined 60,000 jobs. As new information becomes available, the recent employment path may be adjusted again.
The BLS scheduled the October 2026 Employment Situation report for November 6, 2026. That release will provide another observation for assessing payroll growth, unemployment, wages and industry trends.
Until then, the September figures should be understood as a snapshot of a labor market with modest reported payroll growth, a 4.2% unemployment rate, continued nominal wage increases and uneven industry performance. The report supplies evidence for analysis, but not a complete forecast of economic conditions.
Conclusion: Modest Payroll Growth and Uneven Employment Conditions
The September 2026 NFP report recorded an increase of 29,000 nonfarm payroll jobs and an unemployment rate of 4.2%. Average hourly earnings rose 0.1% during the month and 3.0% over the year, while the average workweek remained at 34.4 hours.
The headline payroll figure was below the preceding 12-month average of 45,000. Revisions reduced the combined July and August estimates by 60,000 jobs, changing the recent employment picture from what the initial figures had suggested.
Industry data showed that employment growth was uneven. Health care added 17,000 jobs, construction added 11,000 and manufacturing added 9,000. Government lost 17,000 jobs, information lost 10,000 and professional and business services lost 9,000. Financial activities also recorded a decline.
The household survey added further context. The unemployment rate held at 4.2%, participation was 61.8% and the employment-population ratio was 59.2%. Long-term unemployment accounted for 27.1% of the unemployed population, while 4.501 million people were working part time for economic reasons.
The report’s statistical caveat is central to interpreting the headline. The estimated payroll increase of 29,000 was not statistically significant on its own under the BLS threshold cited in the report. It should therefore be read alongside revisions and other indicators rather than treated as conclusive evidence of a sharp change in labor-market conditions.
Overall, the September NFP data describe a labor market that continued to record payroll gains, but at a measured pace and with significant differences across industries and worker groups. The next reports will be important for determining whether this pattern persists.
Frequently Asked Questions About the September 2026 NFP Report
What was the US NFP number for September 2026?
US nonfarm payrolls increased by 29,000 in September 2026. The increase was below the preceding 12-month average of 45,000 jobs per month. The BLS noted that the monthly change was not statistically significant on its own under the report’s stated threshold.
What was the unemployment rate in September 2026?
The US unemployment rate was 4.2% in September 2026, unchanged from August. The household survey estimated that 7.109 million people were unemployed.
Did US employment grow or decline in September?
The establishment survey reported an increase of 29,000 nonfarm payroll jobs. However, employment changes differed across industries. Health care, construction and manufacturing added jobs, while government, information and professional and business services recorded declines.
Which industries added the most jobs in September 2026?
Among the industries highlighted in the report, health care added 17,000 jobs, construction added 11,000 and manufacturing added 9,000. Leisure and hospitality added 10,000 jobs.
Which industries lost jobs in September 2026?
Government employment declined by 17,000. Information lost 10,000 jobs, professional and business services lost 9,000, and financial activities lost 7,000.
How much did wages increase in September 2026?
Average hourly earnings for private nonfarm employees rose by 5 cents, or 0.1%, to $37.81. Over the preceding 12 months, average hourly earnings increased by 3.0%.
Why were the July and August payroll figures revised?
Monthly payroll estimates are revised as additional employer information becomes available and estimates are updated. In the September report, August was revised from a gain of 162,000 to 133,000, while July was revised from a gain of 21,000 to a decline of 10,000. The combined revision was minus 60,000 jobs.
Was the September 2026 NFP result statistically significant?
No. The reported increase of 29,000 was below the approximate threshold of 122,000 jobs that the BLS cites for statistical significance in the monthly payroll change. The estimate remains part of the published employment record, but it should not be interpreted as a statistically definitive monthly change by itself.
What is the difference between NFP and the unemployment rate?
NFP measures changes in payroll jobs reported by employers through the establishment survey. The unemployment rate measures the share of the civilian labor force that is unemployed and actively seeking work, based on the household survey. The two indicators describe different aspects of employment and are not expected to match exactly.
When will the next US jobs report be released?
The October 2026 Employment Situation report was scheduled for release on November 6, 2026, according to the September report.