



Table of Contents
- Introduction
- Personal Income and Disposable Income Growth
- Analysis of Consumer Spending (PCE)
- Inflation Dynamics: The PCE Price Index
- Real PCE: The Impact on Actual Purchasing Power
- The Personal Saving Rate
- Context: Retail Sales vs. PCE Data
- Methodological Notes and Revisions
- Implications for the Economic Outlook
- Conclusion
Introduction
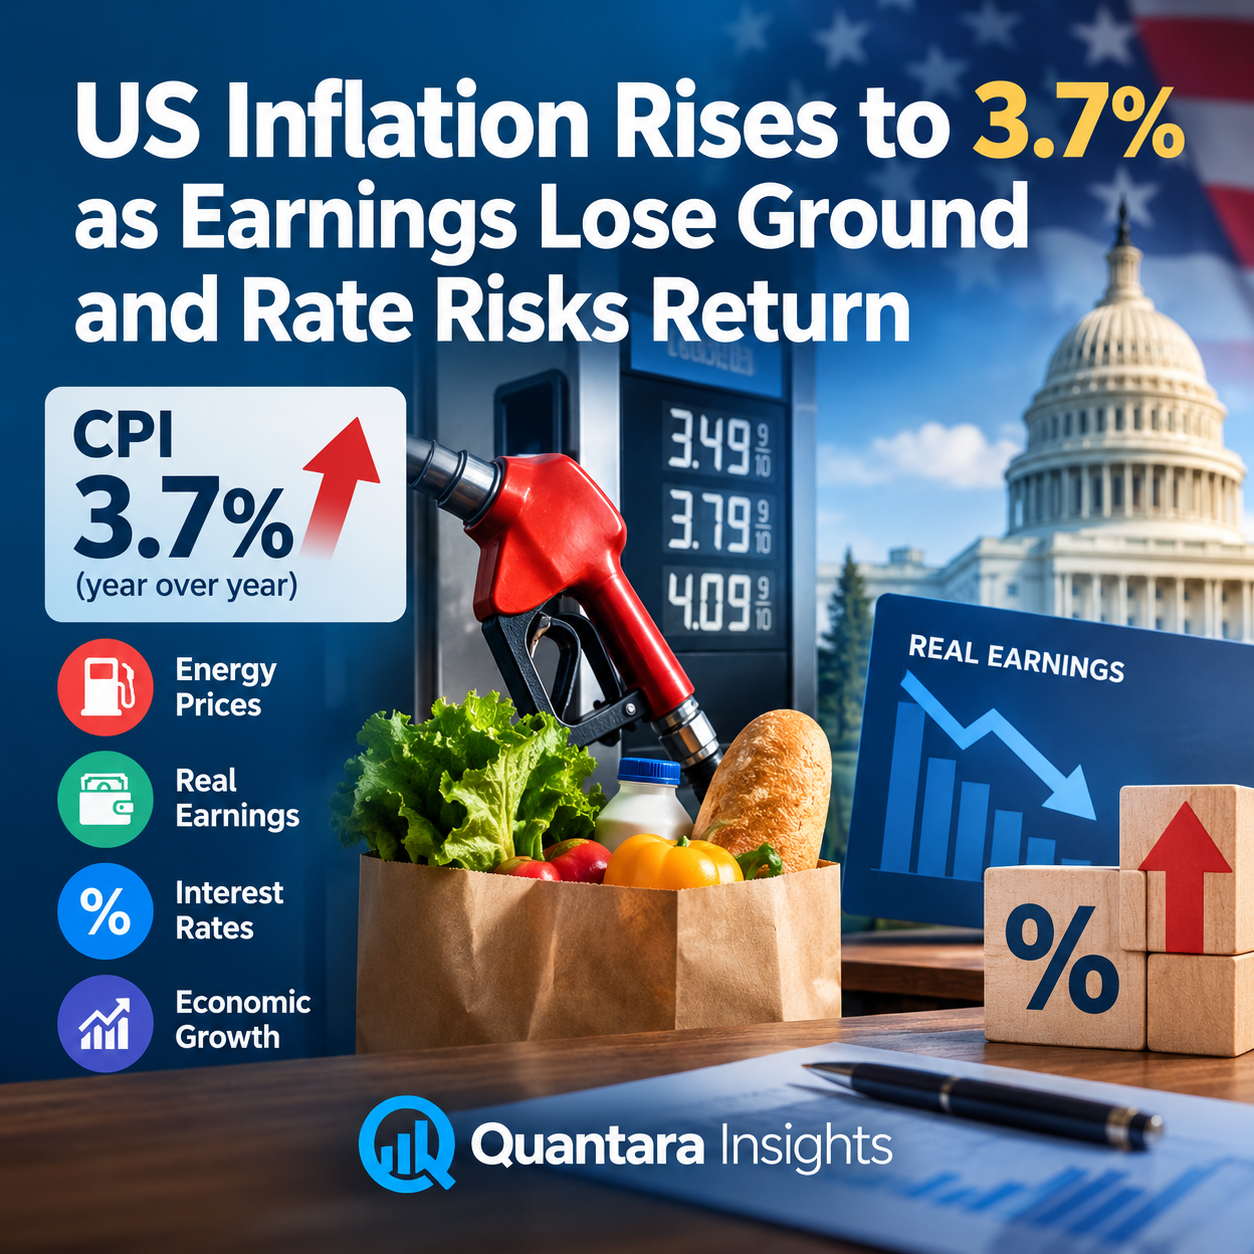
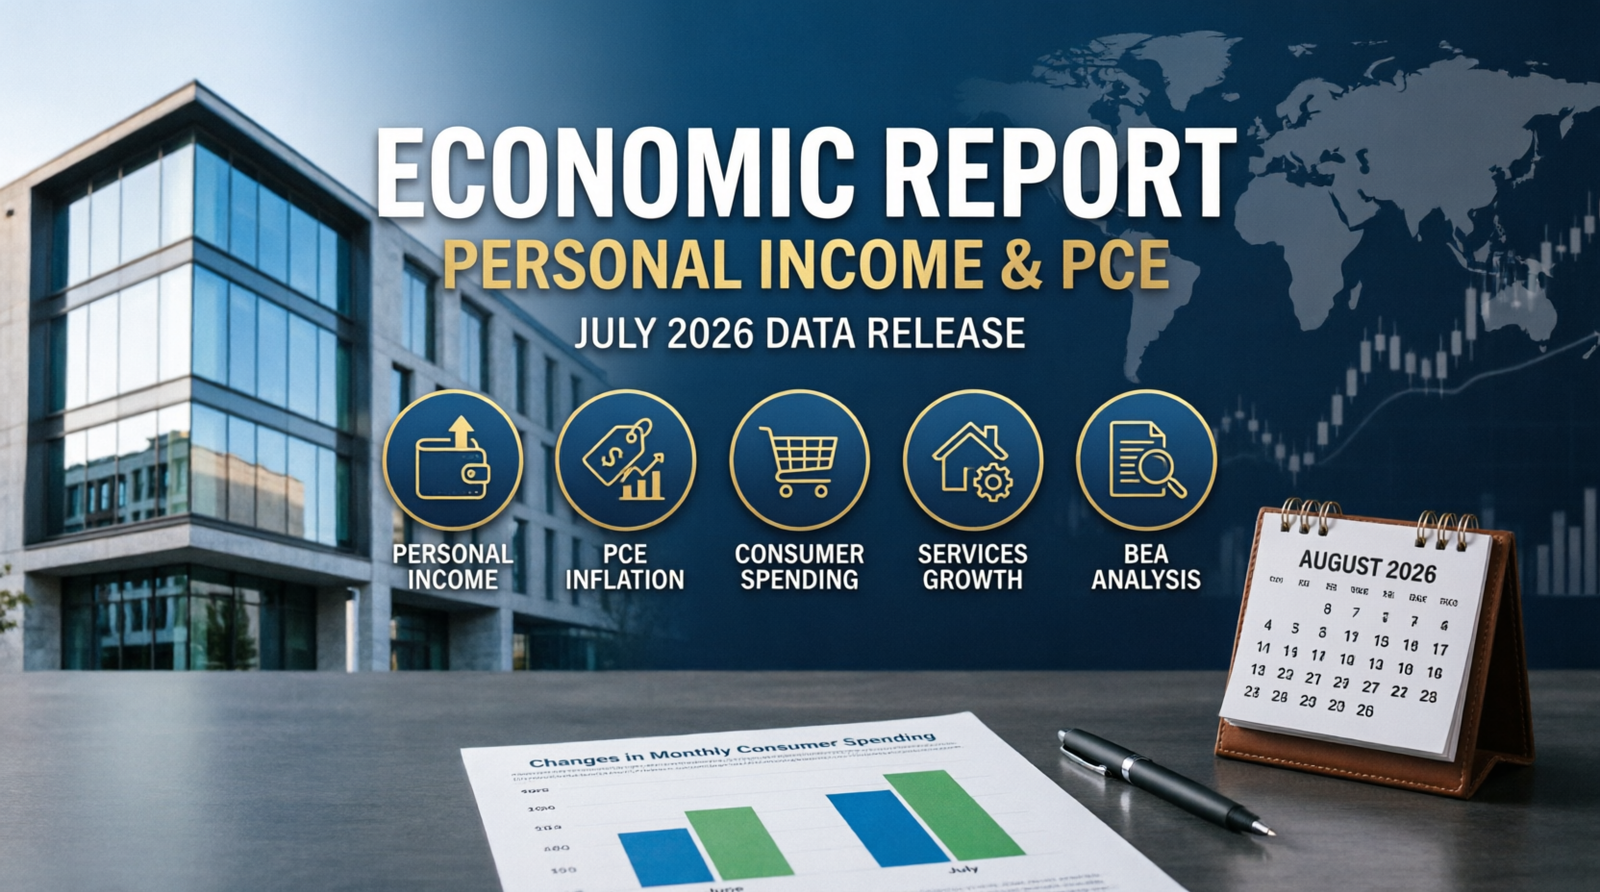
PCE (Personal Consumption Expenditures) data released today by the U.S. Bureau of Economic Analysis (BEA) for July 2026 reveals a complex economic landscape where nominal income growth is accelerating, but real consumption is stalling. The PCE price index, the Federal Reserve’s preferred measure of inflation, increased 0.2 percent month-over-month and 3.7 percent year-over-year. Excluding food and energy, core PCE inflation remained at 3.3 percent annually, signaling that price pressures are proving more persistent than many analysts anticipated. This comprehensive analysis breaks down the key drivers behind the July PCE report, including the bifurcation between services and goods spending, the impact on personal income, and the broader implications for U.S. monetary policy.
Personal Income and Disposable Income Growth
The July data underscores a strengthening in household earnings. Personal income rose by 0.4 percent, surpassing the 0.2 percent increase recorded in June and exceeding market expectations. This marks the ninth consecutive monthly increase in personal income, indicating resilience in the labor market and wage growth. The primary drivers of this increase were higher compensation, particularly in the private sector, alongside an uptick in government social benefits such as Medicaid and Medicare.
When considering taxes, disposable personal income (DPI)—the amount available for households to spend or save—increased by a more substantial $125.9 billion, or 0.5 percent. This growth in DPI is significant as it represents the actual purchasing power available to consumers before accounting for price changes. The acceleration in personal income growth suggests that the labor market remains a robust source of support for households, even as price pressures persist.
Analysis of Consumer Spending (PCE)
Consumer spending, as measured by PCE, increased by $36.3 billion, or 0.2 percent, in July. While this represents a slowdown from the 0.3 percent pace in June, it exceeded the consensus forecast of a 0.1 percent gain. The headline number, however, masks significant variation in consumer behavior across different categories, highlighting a shift in spending priorities that could have broad implications for the U.S. economy.
Services: The Primary Engine of Growth
The increase in consumer spending was almost entirely driven by the services sector. Spending on services surged by $86.2 billion in July, reflecting a robust demand for experiences and essential service categories. This increase was broad-based, with notable gains in several key areas:
- Financial services and insurance: Up $24.3 billion.
- Health care: Up $16.4 billion.
- Housing and utilities: Up $16.4 billion.
- Transportation services: Up $4.8 billion.
- Food services and accommodations: Up $4.6 billion.
This shift toward services suggests that while consumers are willing to spend on experiences and essential service categories, their demand for physical goods is softening. The post-pandemic normalization of spending patterns continues to favor services, a trend that has been consistent throughout 2026.
Goods: A Significant Decline
In contrast to the strength in services, spending on goods decreased by $49.9 billion. This decline was led by a sharp pullback in several major categories:
- Gasoline and other energy goods: Down $14.0 billion.
- Recreational goods and vehicles: Down $13.6 billion.
- Motor vehicles and parts: Down $9.4 billion.
- Furnishings and durable household equipment: Down $3.8 billion.
- Other nondurable goods: Down $6.8 billion.
The decrease in energy goods spending is likely linked to lower prices at the pump, while the reduction in discretionary items like recreational goods and vehicles points to a more cautious consumer. The decline in goods spending suggests that consumers are prioritizing essential services over discretionary purchases, a behavior shift that could weigh on the manufacturing sector in the coming months.
Inflation Dynamics: The PCE Price Index
The PCE price index, the Federal Reserve’s preferred gauge of inflation, showed a subtle rise in July. On a month-over-month basis, the headline PCE price index increased by 0.2 percent, reversing a 0.1 percent decline in June. This print was slightly higher than the 0.1 percent forecast by economists, indicating that inflation pressures remain elevated.
Core PCE: The Fed’s Key Metric

Excluding the volatile food and energy sectors, the core PCE price index also rose by 0.2 percent on the month, matching expectations but accelerating from the 0.1 percent increase seen in June. This “core” metric is crucial for policymakers as it strips out short-term noise to reveal underlying inflation trends. The steady core PCE reading suggests that underlying price pressures are not receding as quickly as hoped, complicating the Federal Reserve’s path toward its 2 percent target.
Year-Over-Year Inflation Data
From a year-over-year perspective, the inflation picture remained sticky:
- Headline PCE Price Index: Increased 3.7 percent from July 2025.
- Core PCE Price Index: Increased 3.3 percent from the prior year.
These annual figures remained unchanged from the previous month and indicate that price pressures are not receding as quickly as some had hoped. The stable year-over-year core PCE rate is a significant factor for the Federal Reserve as it considers the trajectory of interest rates. The persistence of inflation above the 2 percent target suggests that the central bank may need to maintain restrictive monetary policy for longer than previously anticipated.
Real PCE: The Impact on Actual Purchasing Power
While nominal spending appears healthy, it is critical to adjust for inflation to understand the real volume of goods and services purchased. Real PCE, which measures the physical quantity of consumption, increased by a mere $1.3 billion in July, translating to a month-over-month growth rate of less than 0.1 percent.
This near-zero growth in real PCE stands in stark contrast to the 0.4 percent growth in real disposable income observed for the same period. This divergence implies that even though households have more money coming in, they are not significantly increasing their consumption volume, likely due to the eroding effects of inflation on their budget. The sluggishness in real PCE is a concerning signal for economic growth, as consumer spending accounts for roughly two-thirds of U.S. economic activity.
The Personal Saving Rate
The report also provided updated data on household balance sheets. Personal saving for July totaled $712.0 billion. Consequently, the personal saving rate, which is personal saving as a percentage of disposable personal income, settled at 3.0 percent. This rate indicates that consumers are setting aside a modest portion of their income, a level that remains a point of focus for analysts concerned about consumer financial resilience.
A saving rate of 3.0 percent is relatively low compared to historical averages, suggesting that households are maintaining spending levels despite persistent inflation. This could be a sign of consumer confidence or a reflection of the fact that wage gains are keeping pace with price increases, allowing households to maintain their standard of living without drawing down savings significantly.
Context: Retail Sales vs. PCE Data
The BEA’s PCE report is often analyzed in conjunction with the Census Bureau’s monthly retail sales data, which was released earlier in the month. The July retail sales data showed a 0.6 percent decline, indicating a softening in consumer demand for goods at the start of the third quarter. This data point aligns well with the significant drop in goods spending observed in the official PCE report.
However, the retail sales data also highlighted the strength of the services sector, noting that spending at restaurants and bars increased by 0.5 percent, providing a parallel to the services-led growth seen in the official PCE report. The divergence between goods and services spending is a consistent theme across both datasets, reinforcing the narrative of a consumer economy that is transitioning away from physical goods toward experiential spending.
Methodological Notes and Revisions
The BEA report also noted revisions to previous estimates. Data for April through June was revised to incorporate updated employment and earnings data from the U.S. Bureau of Labor Statistics and revised benefit information for Medicaid. These revisions are a standard part of the economic accounting process, ensuring that historical data aligns with the most current information available. The revised data showed that personal income growth was slightly stronger in previous months than initially estimated, while PCE growth was marginally weaker, providing a more accurate picture of the economy’s trajectory.
Implications for the Economic Outlook
The July report presents a challenging landscape for U.S. economic policymakers:

- Labor Market Support: The continued growth in personal income suggests the labor market remains solid, providing a foundation for the economy. However, the pace of wage growth must be weighed against the persistence of inflation to determine real household progress.
- Persistent Inflation: The steady 3.3 percent annual core PCE inflation rate is above the Federal Reserve’s 2 percent target. This suggests that the central bank may need to maintain restrictive monetary policy for longer to ensure price stability. The Fed’s next policy meeting will likely focus on whether the current rate environment is sufficiently restrictive to bring inflation back to target.
- Consumer Caution: The stall in real consumer spending and the decline in durable goods purchases indicate that consumers are becoming more selective and price-sensitive. While the shift toward services provides some support, the pullback in goods is a warning sign for the manufacturing sector. Retailers and manufacturers may face headwinds as households prioritize essential services over discretionary goods.
Conclusion
The U.S. Bureau of Economic Analysis’ July 2026 report highlights a bifurcated consumer landscape. While personal income growth accelerated, driven by compensation and social benefits, the benefits did not translate into a proportionate increase in real spending. The economy showed a distinct shift in consumer spending from goods to services, with financial, health, and housing-related services seeing the most significant gains.
Meanwhile, PCE data confirmed that inflation remained a persistent force, with the core PCE price index holding steady on an annual basis. This mix of slowing real consumption and sticky price pressures presents a complex scenario for the Federal Reserve, which must balance the dual goals of managing inflation and supporting economic growth. As consumers exhibit increased sensitivity to prices, the path of personal income and the direction of price indexes will remain critical data points for assessing the health of the U.S. economy in the upcoming months. The July PCE report underscores that while the labor market remains a source of strength, the persistent inflation environment continues to constrain real household purchasing power, posing challenges for sustained economic expansion.